Hi,
In production, I've upgraded from spring boot webflux + zipkin 2.7.x App to spring boot webflux + zipkin 3.0.4 and I have noticed a memory leak in the heap.
I've distilled the problem down and there is a memory leak with the combination of WebFlux 3.0 + micrometer-tracing-bridge-brave + enableAutomaticContextPropagation. https://github.com/davidmelia/spring-cloud-function-zipkin/tree/memory_leak shows an example. If you run the app and ping the health check then over time the heap fills
#!/bin/bash
for i in {1..500}
do
   curl http://localhost:8080/actuator/health
done
You will notice brave.baggage.CorrelationUpdateScope$Multiple is never totally reclaimed by garbage collection and builds up over time:
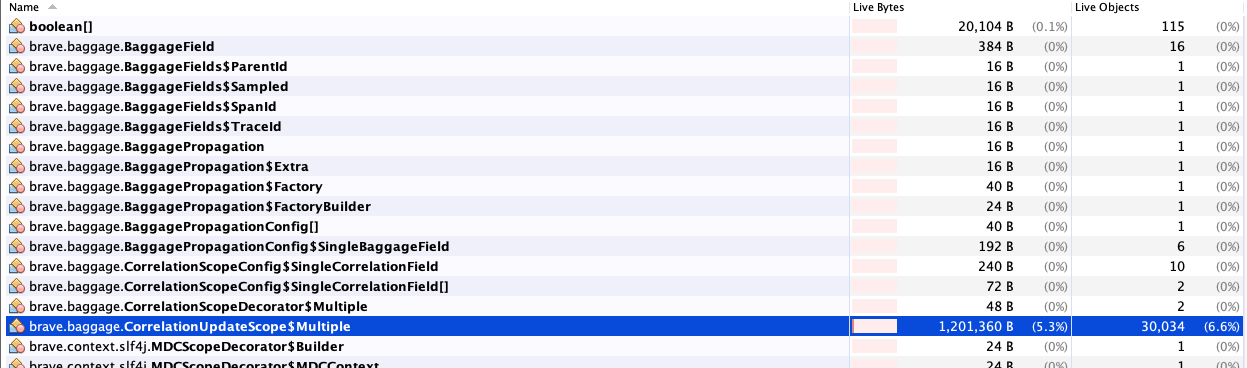
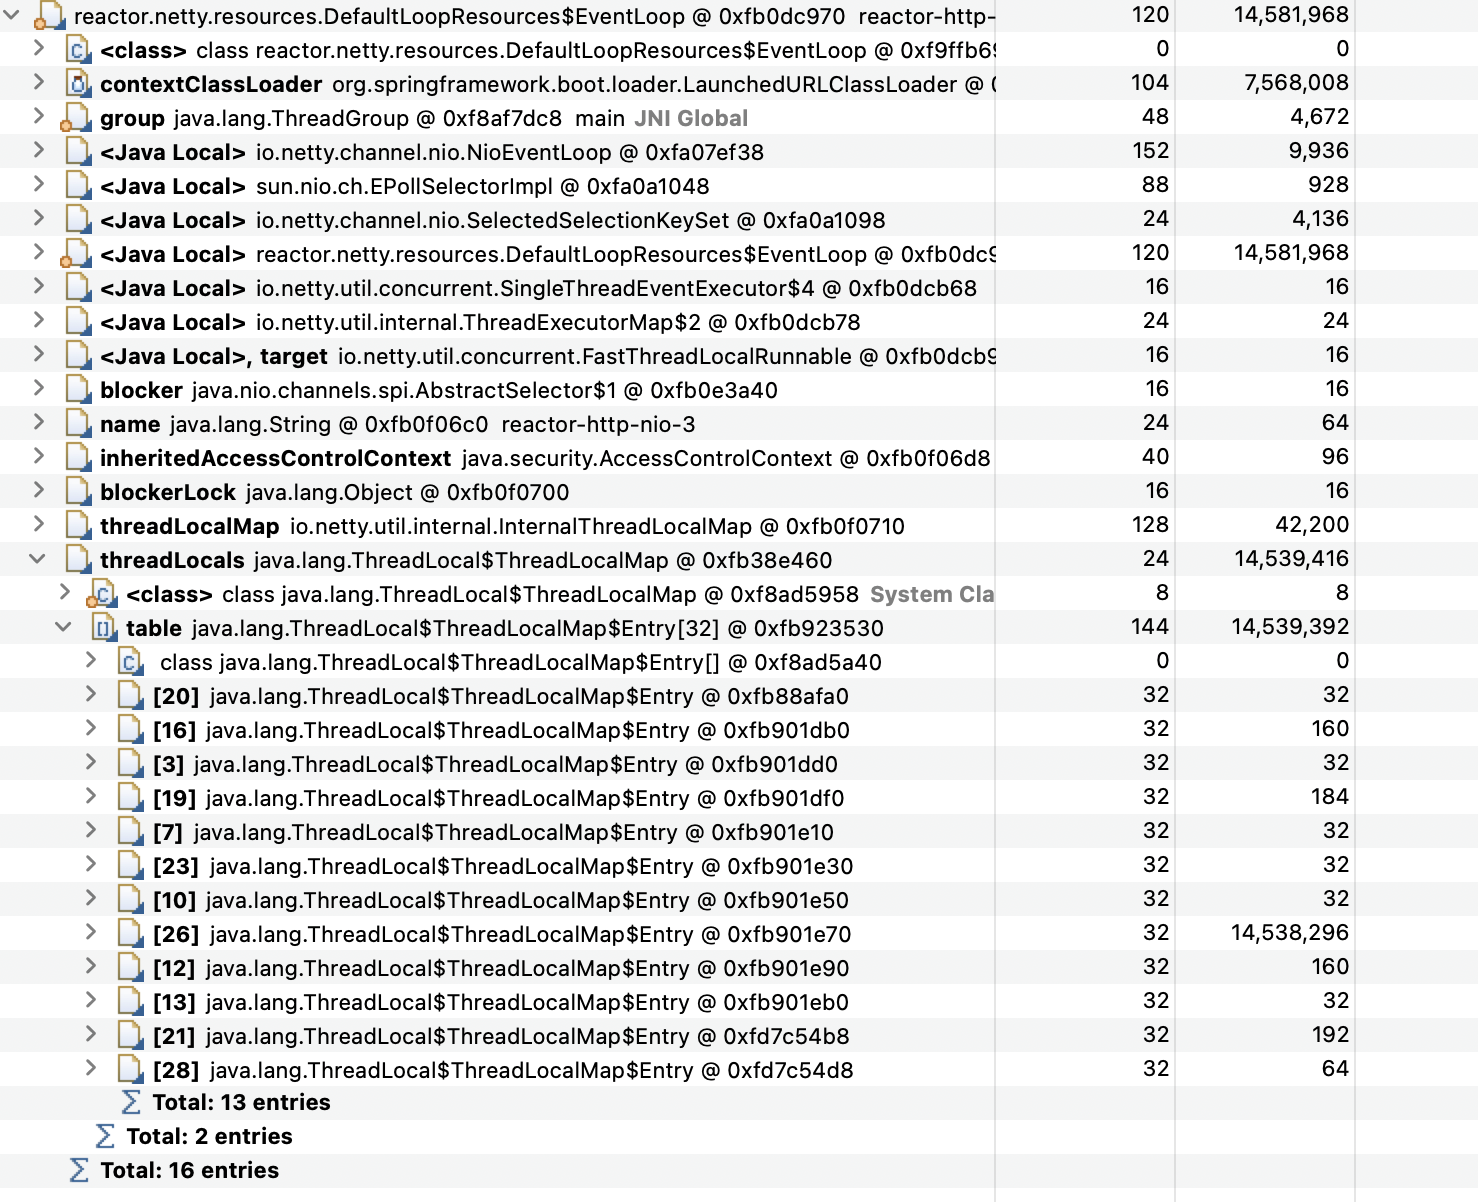
I've plugged the heap dump into the eclipse memory analyser and it looks like reactor.netty.resources.DefaultLoopResources$EventLoop is keeping hold of thread locals:

N.B I appreciate this looks like a problem with either Hooks.enableAutomaticContextPropagation or micrometer-tracing-bridge-brave however it manifest in Spring Boot Webflux
(relates to https://github.com/spring-projects/spring-boot/issues/34201)
Comment From: marcingrzejszczak
Should be fixed via https://github.com/micrometer-metrics/tracing/issues/213. Can you check if your problem is gone with 1.0.4-SNAPSHOT of tracing? (I did check that manually but wanted you to confirm that too)
Comment From: davidmelia
I've upgraded to 1.0.4-SNAPSHOT (https://github.com/davidmelia/spring-cloud-function-zipkin/blob/memory_leak_potential_fix/pom.xml) but get a different issue
    *__checkpoint ⇢ HTTP GET "/actuator/health" [ExceptionHandlingWebHandler]
Original Stack Trace:
        at io.micrometer.tracing.handler.TracingObservationHandler.getRequiredSpan(TracingObservationHandler.java:183) ~[micrometer-tracing-1.0.4-SNAPSHOT.jar:1.0.4-SNAPSHOT]
        at io.micrometer.tracing.handler.PropagatingReceiverTracingObservationHandler.onStop(PropagatingReceiverTracingObservationHandler.java:97) ~[micrometer-tracing-1.0.4-SNAPSHOT.jar:1.0.4-SNAPSHOT]
Hmmmmm ...
Comment From: marcingrzejszczak
Wow, I see that too now (I had no-error case for sure in the meantime) - let me look into that
Comment From: marcingrzejszczak
OK I found a bug, I've just applied a fix in tracing (https://github.com/micrometer-metrics/tracing/commit/b8c4ae6ff5c3fd60d5d523924985ebd3343c6e2c) so wait a couple of minutes for the new snapshots
Comment From: davidmelia
@marcingrzejszczak update came down fine

and I get the memory leak:

My project is https://github.com/davidmelia/spring-cloud-function-zipkin/blob/memory_leak_potential_fix/pom.xml and ran the below a few times
#!/bin/bash
for i in {1..500}
do
   curl http://localhost:8080/actuator/health
done
using visualvm memory sampler
Comment From: marcingrzejszczak
wow, that's strange, previously if you ran your app with -ea you would have exceptions being thrown and that was fixed, I thought that that is the root cause. I'll need to investigate this further then
Comment From: davidmelia
Sorry @marcingrzejszczak to be clear when I say same issue it now does work (i.e. no stack trace) but I get the original memory leak.
Comment From: marcingrzejszczak
I have a workaround to get rid of memory leaks. Set this property
management:
  tracing:
    baggage:
      correlation:
        enabled: false
and set this bean
@Bean
  @Order(1)
  CorrelationScopeCustomizer myCorrelationFieldsCorrelationScopeCustomizer(TracingProperties tracingProperties) {
    return (builder) -> {
      List<String> correlationFields = tracingProperties.getBaggage().getCorrelation().getFields();
      for (String field : correlationFields) {
        builder.add(CorrelationScopeConfig.SingleCorrelationField.newBuilder(BaggageField.create(field))
                .build());
      }
    };
  }
in essence it removes the flush on update feature from Brave that is causing the memory leak. We're still investigating the whole problem.
BTW @wilkinsona I think this bug is applicable to all Webflux projects and we should disable the flush on update feature by default for now
Comment From: wilkinsona
Thanks, @marcingrzejszczak. We've got approximately a month till the next Boot releases when we could do that. Perhaps that'll give us some time to figure out a different solution.
Comment From: davidmelia
Thanks @marcingrzejszczak - have pushed your recommendations to https://github.com/davidmelia/spring-cloud-function-zipkin/blob/memory_leak_potential_fix/pom.xml and memory leak has gone.
One slight amendment (I assume a typo) is you need
management:
  tracing:
    baggage:
      correlation:
        enabled: false
Comment From: davidmelia
Hi,
any more update on the real fix for this?
Comment From: marcingrzejszczak
We had an issue with the release of micrometer tracing, once we've fixed it we will let you know
Comment From: siganapathy
@marcingrzejszczak this is regarding your fix given here. Am also facing memory leak issues around this class brave.baggage.CorrelationUpdateScope$Single occupying 55% of number/size of instances and not getting garbage collected even after hours together. My environment - spring boot 2.7.6 + spring cloud sleuth. Here's my gradle file.
plugins {
    id 'org.springframework.boot' version '2.7.6'
    id 'io.spring.dependency-management' version '1.0.11.RELEASE'
    id 'java'
    id 'com.github.sherter.google-java-format' version '0.9'
    id 'jacoco'
    id 'com.gorylenko.gradle-git-properties' version '2.3.1'
}

group = 'com.xxx.yyy'
version = '0.0.1-SNAPSHOT'
sourceCompatibility = '11'

def lombokVersion ='1.18.22'
def openApiVersion = '1.6.7'

repositories {
    mavenCentral()
}

configurations {
    compileOnly {
        extendsFrom annotationProcessor
    }
}

ext {
    set('springCloudVersion', "2021.0.5")
    set('openFeignVersion', "11.8")
}

dependencyManagement {
    imports {
        mavenBom "org.springframework.cloud:spring-cloud-dependencies:${springCloudVersion}"
        mavenBom "org.springframework.session:spring-session-bom:2021.1.2"
    }
}

dependencies {
    implementation(
            "org.springframework.cloud:spring-cloud-starter-circuitbreaker-resilience4j",
            "org.springframework.cloud:spring-cloud-starter-circuitbreaker-reactor-resilience4j",
            "org.springframework.cloud:spring-cloud-starter-gateway",
            "org.springframework.cloud:spring-cloud-starter-openfeign",
            'org.springframework.cloud:spring-cloud-starter-sleuth',
            "io.github.openfeign:feign-jackson:${openFeignVersion}",
            "org.springframework.boot:spring-boot-starter-security",
            "org.springframework.boot:spring-boot-starter-oauth2-client",
            "org.springframework.boot:spring-boot-starter-tomcat",
            "org.springframework.security:spring-security-oauth2-resource-server",
            "org.projectlombok:lombok:${lombokVersion}",
            "org.freemarker:freemarker:2.3.31",
            'commons-codec:commons-codec:1.15',
            'org.apache.commons:commons-lang3:3.12.0',
            "com.squareup.okhttp3:okhttp:4.9.3",
            'net.logstash.logback:logstash-logback-encoder:6.6',
            'org.springframework.boot:spring-boot-starter-actuator',
            "org.springframework.boot:spring-boot-starter-cache",
            "org.springframework.cloud:spring-cloud-sleuth-zipkin",
            "commons-validator:commons-validator:1.7",
            "org.springdoc:springdoc-openapi-webflux-core:${openApiVersion}",
            "org.springdoc:springdoc-openapi-webflux-ui:${openApiVersion}",
            "org.springdoc:springdoc-openapi-security:${openApiVersion}",
            "org.springframework.boot:spring-boot-starter-webflux",
            "org.springframework.session:spring-session-data-redis",
            "io.lettuce:lettuce-core:6.1.8.RELEASE"
    )
}
when i tried setting bean
  @Bean
  @Order(1)
  CorrelationScopeCustomizer myCorrelationFieldsCorrelationScopeCustomizer(TracingProperties tracingProperties) {
    return (builder) -> {
      List<String> correlationFields = tracingProperties.getBaggage().getCorrelation().getFields();
      for (String field : correlationFields) {
        builder.add(CorrelationScopeConfig.SingleCorrelationField.newBuilder(BaggageField.create(field))
                .build());
      }
    };
  }
I get error "Unable to resolve TracingProperties". I couldn't find TracingProperties class in my current gradle deps. any ideas here ?
Comment From: marcingrzejszczak
I don't understand what you're trying to do. This is an issue about Spring Boot 3 and you're showing us Spring Cloud Sleuth :shrug:
Comment From: wilkinsona
Indeed. That looks off-topic to me. @siganapathy please ask questions on Stack Overflow.
Comment From: jonatan-ivanov
Micrometer Tracing 1.0.6 and 1.1.1 were released, Boot is already using these versions and the next release should contain them. You can: 1. Upgrade your dependencies and force the fixed Micrometer Tracing version. 2. Wait for the Boot release (planned tomorrow)
Comment From: mariuszmagdziarz
Is it fixed in SB 3.1.0 @jonatan-ivanov?
Comment From: jonatan-ivanov
@mariuszmagdziarz Yes, see https://github.com/spring-projects/spring-boot/issues/34695#issuecomment-1551940608
Comment From: mariuszmagdziarz
@jonatan-ivanov thank you for information - Closed status made me unsure ;)
Comment From: snicoll
There is a for: external-project label that indicates that the actual decision is not taken here.
Comment From: davidwiniarz
So in SB 3.1.x this problem is gone and no workaround is still needed? If you can confirm @marcingrzejszczak.
Thanks in advance!
Comment From: marcingrzejszczak
So before we release Micrometer 1.10.10 and all the forward merged branches (that release will happen some time within next month) the problem should be gone. You need add the snippet
@Configuration
class class Config {

   @Autowired ObservationRegistry or;

   @PostConstruct
   void setup() {
      ObservationThreadLocalAccessor.getInstance().setObservationRegistry(or);
   }
}
This code can be removed after we release the next patch versions of micrometer projects.
Comment From: davidwiniarz
Thank you @marcingrzejszczak.
Just to be clear - in SB 3.1.x there is no need to add this changes in application.yml(like you mentioned some posts above) with the CorrelationScopeCustomizer myCorrelationFieldsCorrelationScopeCustomizer altogether?
Only this @PostConstruct config and just wait for new release?
Comment From: marcingrzejszczak
@davidmelia correct
Comment From: nikakis
Hello guys! Are you sure that this fixed because we are in SB 3.1.0 and we have exactly the same memory leak with @davidmelia ?
We currently fixed it by disabling the correlation property.
``` management: tracing: baggage: correlation: enabled: false
Comment From: wilkinsona
@nikakis Yes, as described in the comments above, we believe that this has been fixed. If you have evidence to the contrary, we can take a look. First of all, please upgrade to the latest Spring Boot 3.1.x release. If the problem remains, please open a new Micrometer Tracing issue that provides a minimal sample that reproduces it.