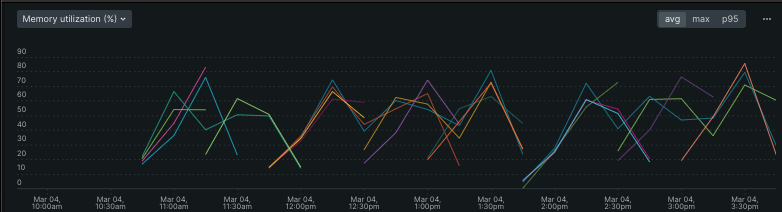
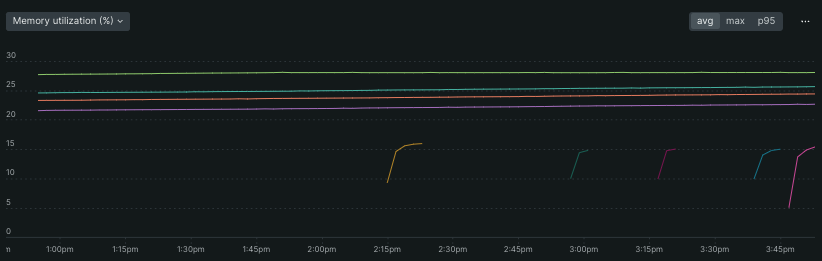
After migrating 3.2.2 to 3.2.3, in our apis memory started to rise until the pods fell:
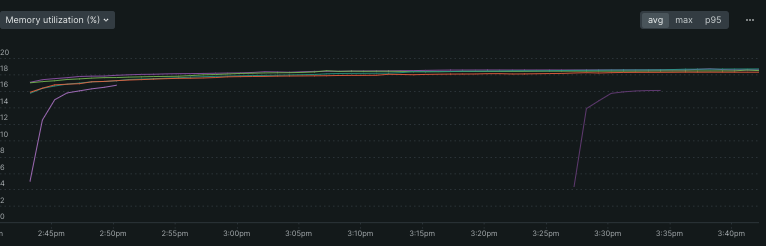
With 3.2.2:
In our tests it appears to be a problem related to aws.
Comment From: wilkinsona
Thanks for the report. Unfortunately, without some more information we won't be able to diagnose the problem. It looks like your application contains a memory leak. I find that the best way to analyse a memory leak is by taking a series of heap dumps and then compare them looking for an increasing number of a particular type of object being retained in the heap.
Due to the risk of a heap dump containing secrets, such analysis is often best done by you. Alternatively, if you're confident that the heap does not contain any information that should not be public, you could share them with us here and we can take a look.
Comment From: bclozel
In our tests it appears to be a problem related to aws.
What do you mean? Do you have data showing more memory consumed by Spring Boot classes? Did you attach a memory profiler to the application?
Please provide more information - right now this report isn't actionable for us.
Comment From: clucca-gb
Thanks for the answer. We are trying to find more detailed information about this issue.
Comment From: clucca-gb
Regarding what I said about AWS, we noticed that only in apis we use spring-cloud-aws (latest version 3.1.0) this problem occurred with the springboot update.
Comment From: clucca-gb
Hello!
I came back here with more details.
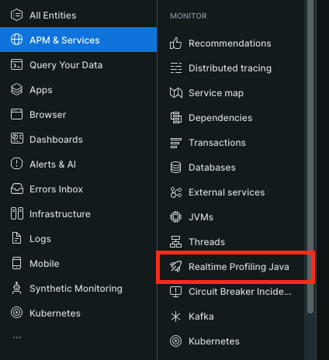
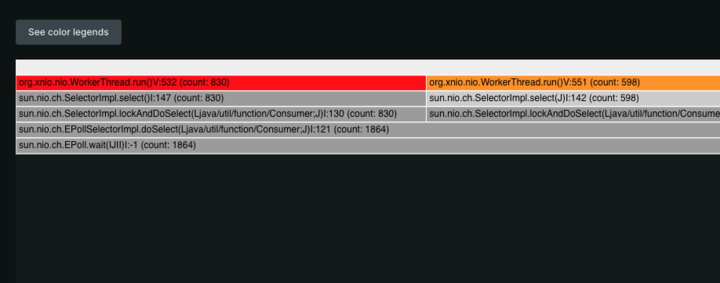
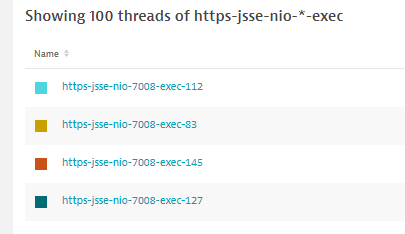
Under analysis with the new relic observability tool:
v3.3.2
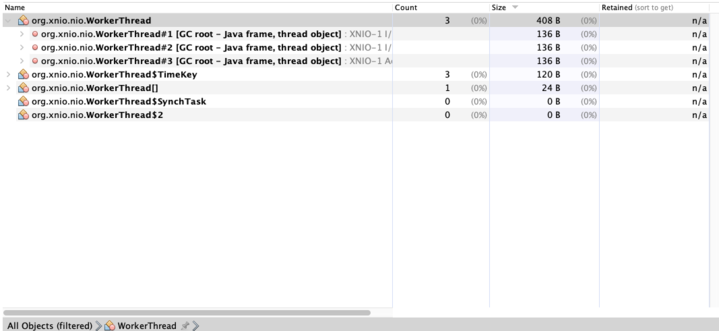
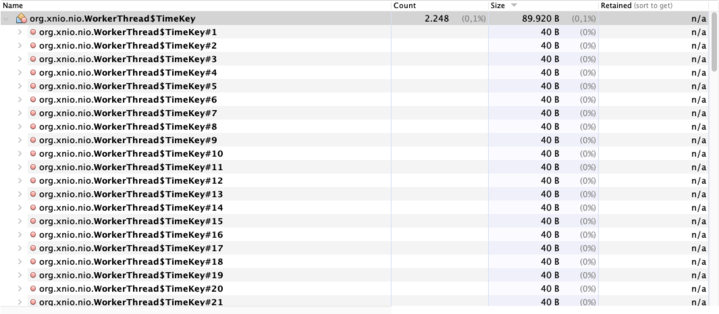

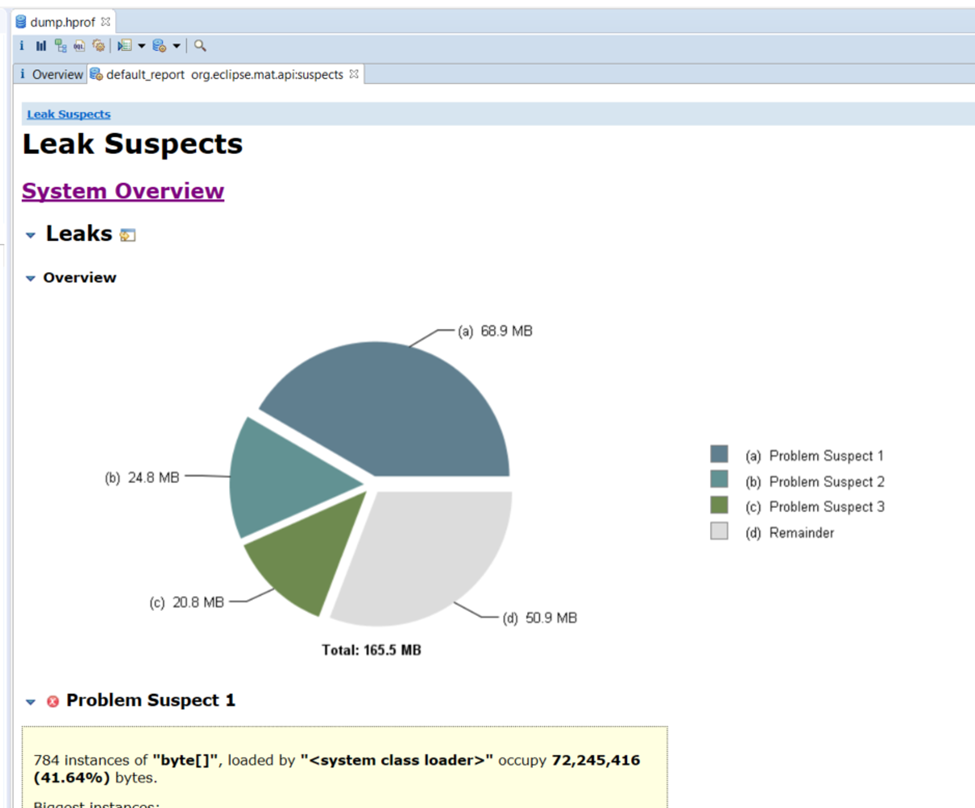
using eclipse memory analyser:
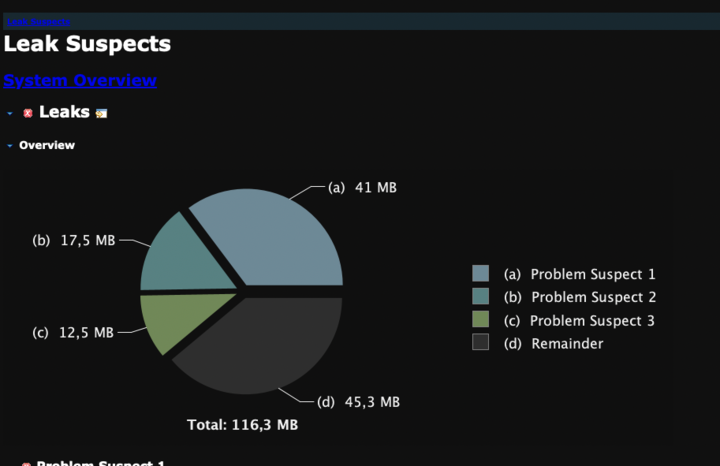
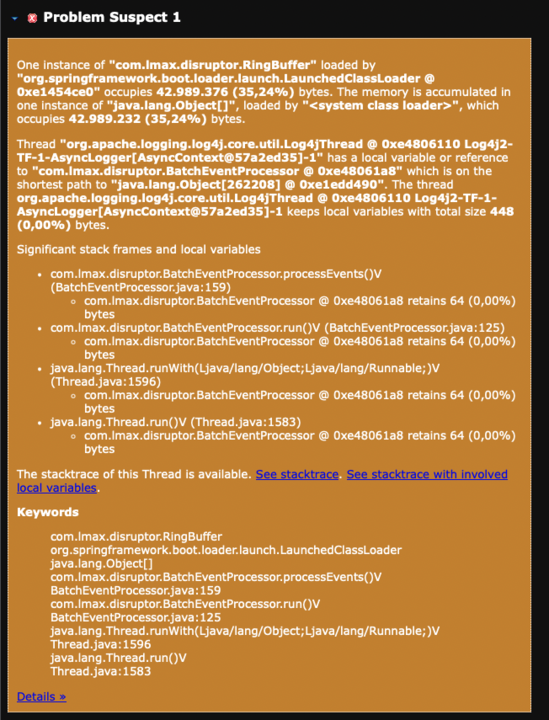
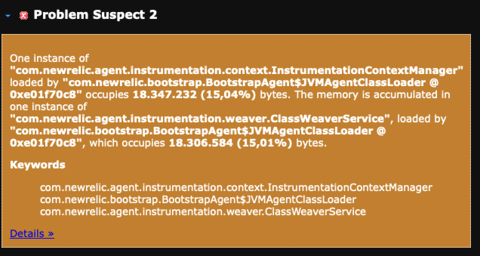
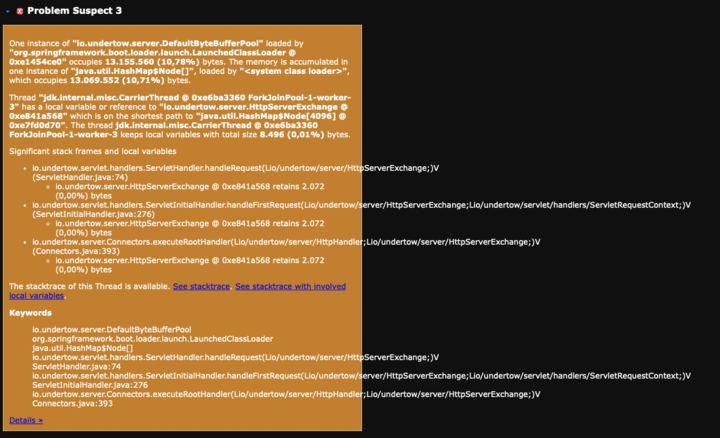
Comment From: wfcosta
Please focus analysis on Problem Suspect 3 of undertow. We thing it this item.
Comment From: wilkinsona
Thanks for the additional details. Spring Boot 3.2.3 upgraded to Undertow 2.3.12.Final. I suspect that it contains a regression that is causing the memory leak. Please try using Spring Boot 3.2.3 with Undertow downgraded to 2.3.10.Final which is the version used by Spring Boot 3.2.2. You may also want to try Undertow 2.3.11.Final to narrow things down further.
Comment From: Tythor
Hi @clucca-gb, are you passing in an executor to the Undertow servlet like this?
@Bean
public UndertowDeploymentInfoCustomizer undertowDeploymentInfoCustomizer() {
   return deploymentInfo -> deploymentInfo.setExecutor(new CustomExecutor());
}
Using Undertow in the default configuration did not cause problems for me until I switched to using a different executor.
Comment From: clucca-gb
@Tythor Hello! Yeah, it is! I'll try to understand if it's possible to remove it.
Comment From: clucca-gb
By the way, we changed Undertown versions to the suggested ones and Memory Leak no longer occurred anymore!
<dependency>
      <groupId>org.springframework.boot</groupId>
      <artifactId>spring-boot-starter-undertow</artifactId>
    </dependency>
        <dependency>
            <groupId>io.undertow</groupId>
            <artifactId>undertow-core</artifactId>
            <version>2.3.10.Final</version>
        </dependency>
        <dependency>
            <groupId>io.undertow</groupId>
            <artifactId>undertow-servlet</artifactId>
            <version>2.3.10.Final</version>
        </dependency>
        <dependency>
            <groupId>io.undertow</groupId>
            <artifactId>undertow-websockets-jsr</artifactId>
            <version>2.3.10.Final</version>
        </dependency>
    <dependency>
Comment From: zhlian94
Hi, I would like to add on my finding from my tech stack. 1. leaking happened to server threads, as many as 200 (display one hundred, and boots default allow 200 as max). these server threads are managing the POST requests “/instances” from API services.
- these leaking threads lock memory and shown as memory leaks but not root cause indeed, if you see this leaking memory such as Byte objects leak(biggest), HttpClient leak, NioEndpoint leak.
- Use Dynatrace profiling tool to check memory allocation, first check ThreadPoolExecutor pool, look for CloseableHTTPClient.execute, I could not find them visually
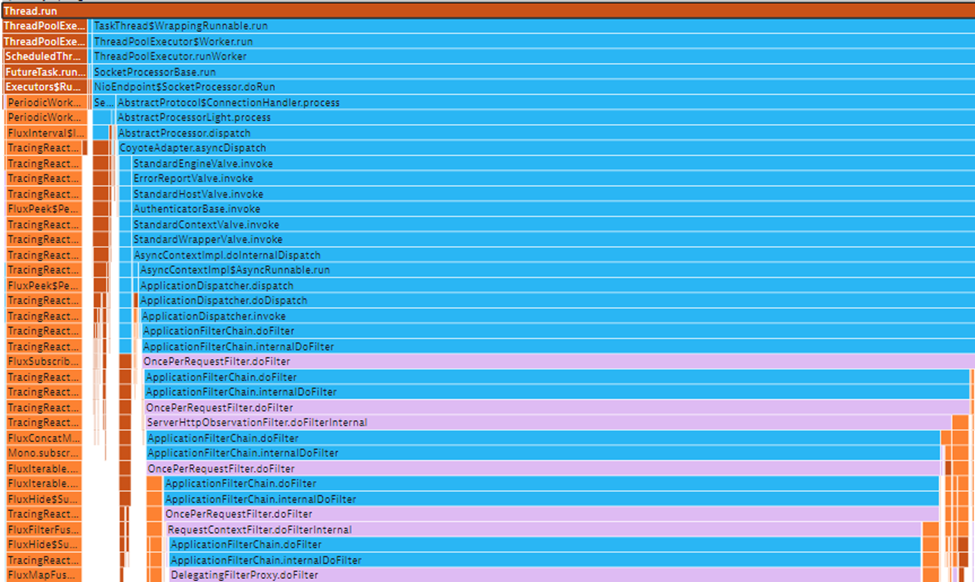
- continue to check FastThreadLocalRunnable which is referenced by each worker in ThreadPoolExcutor above, I could not find CloseableHTTPClient.execute either.

- Given FastThreadLocalRunnable worker to manage all concurrent threads and the parallel threads are self-managed, who are going to manage the server threads in ThreadPoolExecutor? Given the finding that no CloseableHTTPClient is implemented, any leftover in thread local could make the server threads leak. Or If CloseableHTTPClient is implemented, how to manage reference from server worker to FastThreadLocalRunnable pool? Seems the thread leaks involved a dilemma in design and not resolved and leave it as leak hole. Hope these feedbacks help designers and help to resolve the leak quicker. I intend to disable POST on boots server threads to stop thread leaking as temporary solution. I would like to hear your opinions. Regards
Comment From: wilkinsona
That's good news. Thanks, @clucca-gb. Please open an Undertow issue so that they can investigate why configuring a custom executor as you have done now causes a memory leak. I'll close this issue for now as I don't think there's anything we can do about this in Spring Boot.
Comment From: wilkinsona
@zhlian94 your problem appears to be unrelated. As far as I tell you're using Tomcat, not Undertow, and are perhaps using a Reactor Netty based WebClient too. If you'd like some help investigating why your application appears to be leaking memory, please ask on Stack Overflow to begin with.