The context
In my application (Spring Boot 3.2.6), I'm using the GraphQL, Web and JPA starters.
I have created a GraphQL controller, in which I interact with a JPA repository.
I have also enabled observability with Micrometer.
The issue
When I query my controller, everything executes successfully, but I can find this log line (formatted for clarity purpose) :
[...] WARN [...] --- [nio-8080-exec-3] [app=My Application, traceId=7f1a080fea0a3662e74ce0f85d00664b, spanId=3f4b468cb5bccffd] i.m.o.c.ObservationThreadLocalAccessor :
Observation <{
    name=http.server.requests(null),
    error=null,
    context=name='http.server.requests',
    contextualName='null',
    error='null',
    lowCardinalityKeyValues=[
        exception='none',
        method='POST',
        outcome='SUCCESS',
        status='200',
        uri='UNKNOWN'
    ],
    highCardinalityKeyValues=[
        http.url='/graphql'
    ],
    map=[
        class io.micrometer.tracing.handler.TracingObservationHandler$TracingContext='TracingContext{
            span=ImmutableSpanContext{
                traceId=7f1a080fea0a3662e74ce0f85d00664b,
                spanId=6664922c03ad4f85,
                traceFlags=01,
                traceState=ArrayBasedTraceState{entries=[]},
                remote=false,
                valid=true
            }
        }',
        class io.micrometer.core.instrument.LongTaskTimer$Sample='SampleImpl{
            duration(seconds)=0.0147542,
            duration(nanos)=1.47542E7,
            startTimeNanos=29155328641800
        }',
        class io.micrometer.core.instrument.Timer$Sample='io.micrometer.core.instrument.Timer$Sample@3b0b7fc2'
    ],
    parentObservation=null
}>
to which we're restoring is not the same as the one set as this scope's parent observation
<{
    name=graphql.datafetcher(null),
    error=null,
    context=name='graphql.datafetcher',
    contextualName='null',
    error='null',
    lowCardinalityKeyValues=[
        graphql.error.type='NONE',
        graphql.field.name='retrieveBookById',
        graphql.outcome='SUCCESS'
    ],
    highCardinalityKeyValues=[
        graphql.field.path='/retrieveBookById'
    ],
    map=[
        class io.micrometer.tracing.handler.TracingObservationHandler$TracingContext='TracingContext{
            span=ImmutableSpanContext{
                traceId=7f1a080fea0a3662e74ce0f85d00664b,
                spanId=a4204ff90062fd5a,
                traceFlags=01,
                traceState=ArrayBasedTraceState{entries=[]},
                remote=false,
                valid=true
            }
        }',
        class io.micrometer.core.instrument.LongTaskTimer$Sample='SampleImpl{
            duration(seconds)=0.0108987,
            duration(nanos)=1.08987E7,
            startTimeNanos=29155332569100
        }',
        class io.micrometer.core.instrument.Timer$Sample='io.micrometer.core.instrument.Timer$Sample@48ad6d4a'
    ],
    parentObservation={
        name=graphql.request(null),
        error=null,
        context=name='graphql.request',
        contextualName='null',
        error='null',
        lowCardinalityKeyValues=[
            graphql.operation='query',
            graphql.outcome='INTERNAL_ERROR'
        ],
        highCardinalityKeyValues=[
            graphql.execution.id='3bb1672e-660d-bb96-d7c5-4bd6ceb56cd6'
        ],
        map=[
            class io.micrometer.tracing.handler.TracingObservationHandler$TracingContext='TracingContext{
                span=ImmutableSpanContext{
                    traceId=7f1a080fea0a3662e74ce0f85d00664b,
                    spanId=deeb0dd86af7c990,
                    traceFlags=01,
                    traceState=ArrayBasedTraceState{entries=[]},
                    remote=false,
                    valid=true
                }
            }',
            class io.micrometer.core.instrument.LongTaskTimer$Sample='SampleImpl{
                duration(seconds)=0.0138164,
                duration(nanos)=1.38164E7,
                startTimeNanos=29155329694600
            }',
            class io.micrometer.core.instrument.Timer$Sample='io.micrometer.core.instrument.Timer$Sample@3930f5ed'
        ],
        parentObservation={
            name=http.server.requests(null),
            error=null,
            context=name='http.server.requests',
            contextualName='null',
            error='null',
            lowCardinalityKeyValues=[
                exception='none',
                method='POST',
                outcome='SUCCESS',
                status='200',
                uri='UNKNOWN'
            ],
            highCardinalityKeyValues=[
                http.url='/graphql'
            ],
            map=[
                class io.micrometer.tracing.handler.TracingObservationHandler$TracingContext='TracingContext{
                    span=ImmutableSpanContext{
                        traceId=7f1a080fea0a3662e74ce0f85d00664b,
                        spanId=6664922c03ad4f85,
                        traceFlags=01,
                        traceState=ArrayBasedTraceState{entries=[]},
                        remote=false, valid=true
                    }
                }',
                class io.micrometer.core.instrument.LongTaskTimer$Sample='SampleImpl{
                    duration(seconds)=0.0149397,
                    duration(nanos)=1.49397E7,
                    startTimeNanos=29155328641800
                }',
                class io.micrometer.core.instrument.Timer$Sample='io.micrometer.core.instrument.Timer$Sample@3b0b7fc2'
            ],
            parentObservation=null
        }
    }
}>.
Most likely a manually created Observation has a scope opened that was never closed. This may lead to thread polluting and memory leaks.
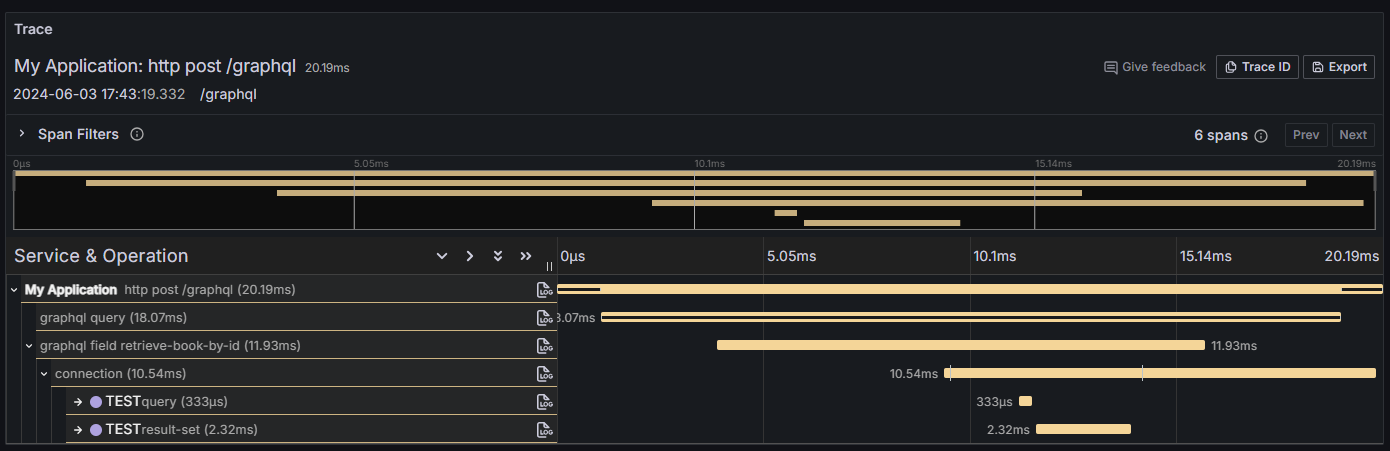
When I connect my application to an Open Telemetry with a Jaeger backend, just to check if everything is ok in terms of trace and spans, it seems that yeah, everything is ok :
This log is not generated if I remove interaction with my JPA repository.
It's also not generated if I annotate the method of my controller (the one annotated with @QueryMapping) with @Observed.
How to reproduce
You can find a sample application right here.
You can query the controller with these information :
- URL : http://localhost:8080/graphql
- Query :
graphql
  retrieveBookById(id: "book-1") {
    id
    name
  }
Comment From: nikb1tamerfdp
Do you have any news about this issue ?
Comment From: bclozel
Hello there, sorry I lost track and forgot to get back to you here. Thanks for the detailed report and the minimal sample, it's really useful.
I'm not sure about the actual source of the problem, but I think that the JPA instrumentation assumes something that is invalid in this case here. First, a bit a background:
- Spring for GraphQL instruments your controller methods by setting/restoring thread locals before/after calling it. Around this method execution, things can be executed asynchronously on various threads, so we don't rely on threadlocals but we store the current observation in the GraphQL context. I have checked that this behavior is correct.
- when a controller method is executed, child observations can be started and they will be shown in the resulting traces
In this case, I think that a specific observation is started with the call to the JPA repository and that somehow this child observation is not closed before the GraphQL data fetching observation (your controller call) is ended. I think this observation is stopped later. While this probably won't cause leaks, the trace might look strange.
I suspect this is due to the datasource observation, keeping things opened as long as the JPA session is opened. I have added the following configuration to your application and I don't see the issue anymore:
spring:
  jpa:
    open-in-view: false
I think you should create an issue against the "datasource-micrometer-spring-boot" to ask for clarification there. In your case, disabling the open session in view filter might cause problems if you're fetching an entity with lazy members and they are later accessed because the GraphQL document is requesting those. But it probably forces resources to be closed when the call to the JPA repository is done, ending the child observation as it should.
I'm closing this issue for now on the Spring Boot side. If changes are required, they're probably in that datasource project or in spring-graphql, not here.
Thanks!
PS: if you'd like to use your GitHub account professionally, maybe consider updating your id - there are a few french speaking people working in OSS out there. 😆
Comment From: mp911de
Paging @jonatan-ivanov and @marcingrzejszczak. Spring Data JPA isn't involved with observability instrumentation. Infrastructure components for data source observability come from different projects.