I noticed that no observation spans will be created for HTTP calls to Actuator endpoints only if you are running management endpoints on a separate port than the application port.
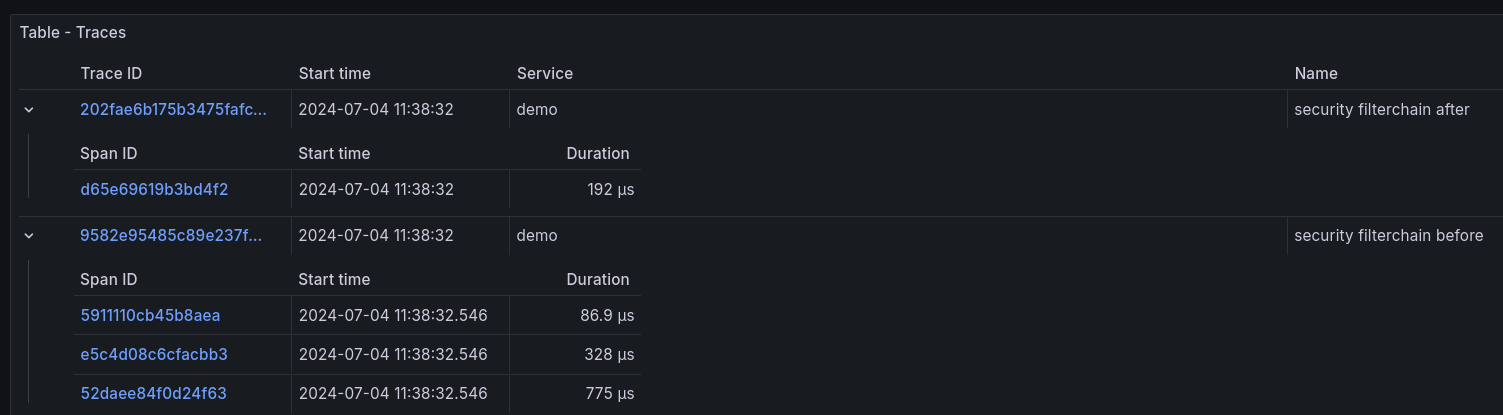
It gets even worse when security is enabled in the application. Spring Security will create two observations for "security filterchain before", "security filterchain after", which are two separate traces with different IDs due to having no common parent span. Nothing in those traces indicate which HTTP endpoint was called to invoke those observations. Screenshot from Grafana:
A little debugging revealed that ServerHttpObservationFilter is not being invoked for Actuator calls on the management port. The filter does get invoked if application port and management port are the same.
Maybe this is related to this issue: https://github.com/spring-projects/spring-boot/issues/16098
How to reproduce
Take my sample application from here: https://github.com/atrepczik/spring-boot-actuator-tracing-issue
Also, to analyze the traces, you can quickly set up a local tracing stack using: https://github.com/grafana/docker-otel-lgtm
- Start the application
- Send HTTP request to any Actuator endpoint, e.g.
http://localhost:8080/actuator/health. Wait ~10s for the logs to ship to Tempo. - In Grafana, go to Explore > Tempo > Search > Run query. The trace looks as expected.
- Now, set
management.server.port=8081and restart the application - Send another request, this time to
http://localhost:8081/actuator/health. Now observe in Grafana that no "http get /actuator/health" spans were created. Instead, you have two separate spans from Spring Security.
Comment From: bclozel
Thanks for raising this - this is effectively a duplicate of #16098. I'm closing this issue as a duplicate. Please subscribe to the other issue for updates.