Affects: Spring 5.2.4
We have a relatively large, monolithic Spring Boot application and I have been doing some profiling of our integration tests. For context, our application has 1127 bean definitions and a majority of our performance issues are in our code base.
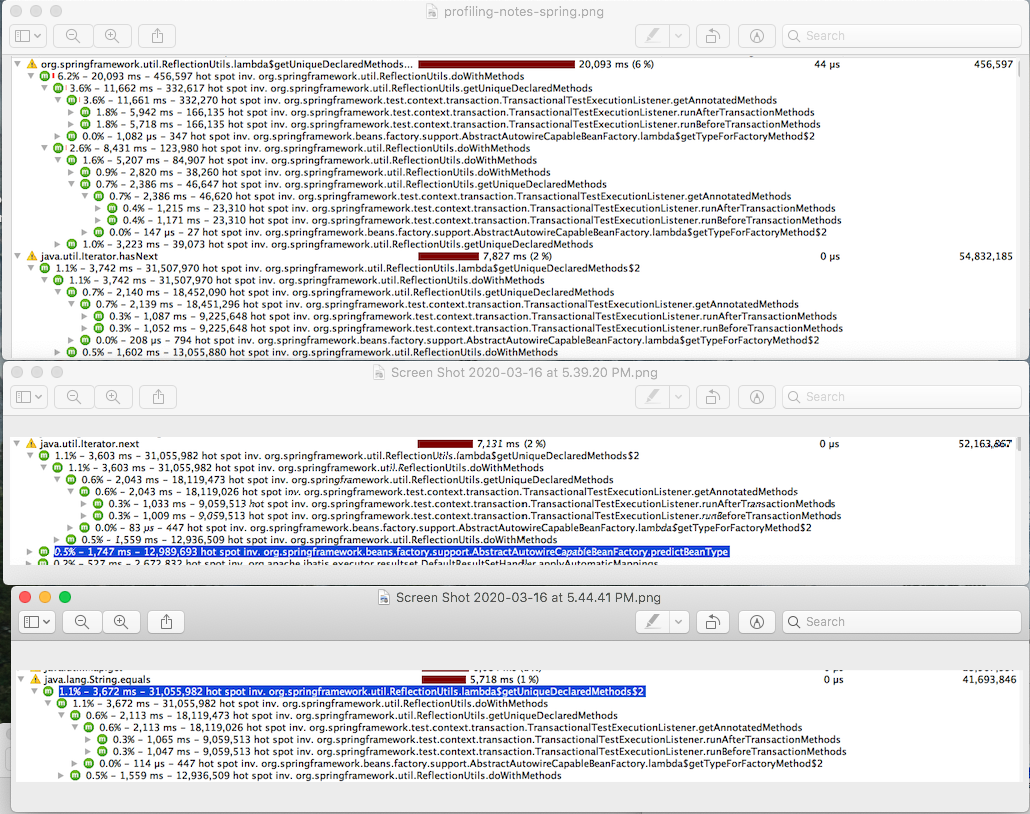
However, I did find a hotspot in the TransactionalTestExecutionListener. It has two methods to find annotated methods on the test class: runBeforeTransactionMethods() and runAfterTransactionMethods.
I am using JProfiler with full instrumentation, so the times are skewed :
After looking at the code for a bit, I extended the listener to cache the list of methods for a given class and replaced the the default listener with our custom listener:
public class CachingTransactionalTestExecutionListener extends TransactionalTestExecutionListener {


    /**
     * A cache of class -> methods annotated with BeforeTransaction.
     */
    private static LruClassMethodCache beforeTransactionMethodCache = new LruClassMethodCache(4);

    /**
     * A cache of class -> methods annotated with AfterTransaction.
     */
    private static LruClassMethodCache afterTransactionMethodCache = new LruClassMethodCache(4);

    @Override
    protected void runBeforeTransactionMethods(TestContext testContext) throws Exception {

        try {
            List<Method> methods = beforeTransactionMethodCache.get(testContext.getTestClass());
            if (methods == null) {

                methods = getAnnotatedMethods(testContext.getTestClass(), BeforeTransaction.class);
                Collections.reverse(methods);
                for (Method method : methods) {
                    ReflectionUtils.makeAccessible(method);
                }
                beforeTransactionMethodCache.put(testContext.getTestClass(), methods);
            }
            for (Method method : methods) {
                if (logger.isDebugEnabled()) {
                    logger.debug("Executing @BeforeTransaction method [" + method + "] for test context " + testContext);
                }
                method.invoke(testContext.getTestInstance());
            }
        }
        catch (InvocationTargetException ex) {
            if (logger.isErrorEnabled()) {
                logger.error("Exception encountered while executing @BeforeTransaction methods for test context " +
                        testContext + ".", ex.getTargetException());
            }
            ReflectionUtils.rethrowException(ex.getTargetException());
        }
    }

    protected void runAfterTransactionMethods(TestContext testContext) throws Exception {
        Throwable afterTransactionException = null;

        List<Method> methods = afterTransactionMethodCache.get(testContext.getTestClass());
        if (methods == null) {
            methods = getAnnotatedMethods(testContext.getTestClass(), AfterTransaction.class);
            for (Method method : methods) {
                    if (logger.isDebugEnabled()) {
                        logger.debug("Executing @AfterTransaction method [" + method + "] for test context " + testContext);
                    }
                    ReflectionUtils.makeAccessible(method);
            }
            afterTransactionMethodCache.put(testContext.getTestClass(), methods);
        }

        for (Method method : methods) {
            try {
                if (logger.isDebugEnabled()) {
                    logger.debug("Executing @AfterTransaction method [" + method + "] for test context " + testContext);
                }
                method.invoke(testContext.getTestInstance());
            }
            catch (InvocationTargetException ex) {
                Throwable targetException = ex.getTargetException();
                if (afterTransactionException == null) {
                    afterTransactionException = targetException;
                }
                logger.error("Exception encountered while executing @AfterTransaction method [" + method +
                        "] for test context " + testContext, targetException);
            }
            catch (Exception ex) {
                if (afterTransactionException == null) {
                    afterTransactionException = ex;
                }
                logger.error("Exception encountered while executing @AfterTransaction method [" + method +
                        "] for test context " + testContext, ex);
            }
        }

        if (afterTransactionException != null) {
            ReflectionUtils.rethrowException(afterTransactionException);
        }
    }

// ...

    private static class LruClassMethodCache extends LinkedHashMap<Class<?>, List<Method>> {

        /**
         * Create a new {@code LruCache} with the supplied initial capacity
         * and load factor.
         * @param initialCapacity the initial capacity
         * @param loadFactor the load factor
         */
        LruClassMethodCache(int initialCapacity) {
            super(initialCapacity);
        }

        @Override
        protected boolean removeEldestEntry(Map.Entry<Class<?>, List<Method>> eldest) {
            if (size() > 4) {
                return true;
            } else {
                return false;
            }
        }
    }

    static class PostProcessor implements DefaultTestExecutionListenersPostProcessor {

        @Override
        public Set<Class<? extends TestExecutionListener>> postProcessDefaultTestExecutionListeners(
                Set<Class<? extends TestExecutionListener>> listeners) {
            Set<Class<? extends TestExecutionListener>> updated = new LinkedHashSet<>(listeners.size());
            for (Class<? extends TestExecutionListener> listener : listeners) {             updated.add(listener.equals(TransactionalTestExecutionListener.class)
                        ? CachingTransactionalTestExecutionListener.class : listener);
            }
            return updated;
        }
To test this, I created 10 IT classes (each with 50 methods), and just do a simple assert. :
public class Example1IT  extends BaseDaoTest  {

    @Test
    public void test1() {
        assertThat("This String").isNotNull();
    }
    @Test
    public void test2() {
        assertThat("This String").isNotNull();
    }

    // ...

    @Test
    public void test50() {
        assertThat("This String").isNotNull();
    }
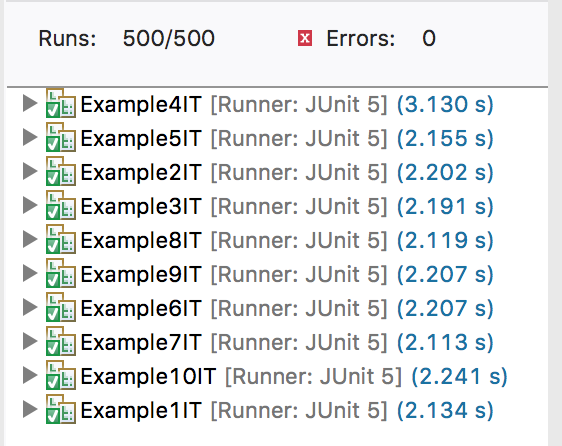
There is some "noise" because I am running this on my machine but the results look promising (but definitely not scientific 8)
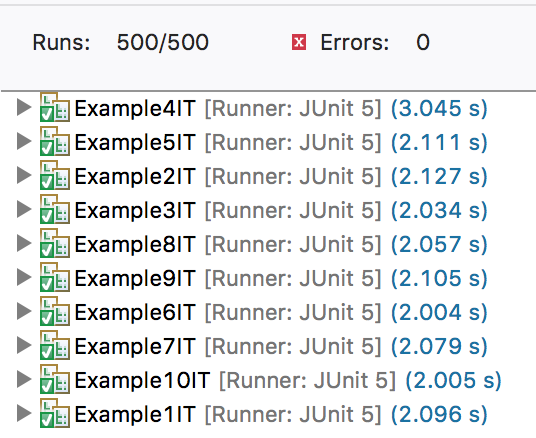
After this change, the hotspot is no longer present in our profiling results and when running those 500 tests with no profiler in play:
Before:
After:
I wish I could report back how this change impacts our 8000+ integration test but I am currently working from home and the database activity over the VPN makes it very difficult to get repeatable results.
Comment From: sbrannen
Thanks for bringing this to our attention.
Introducing an LRU cache for those annotated methods is certainly doable, but I wonder what we want to set for the max-size and whether we would need to make that configurable (analogous the configurable max-size for the context cache).
@jhoeller, what are your thoughts on such an enhancement?
Comment From: tkvangorder
yeah, I wasn't sure what size to make it, for the most part our tests run single-threaded. One thing I can try this morning is to add some timers around those methods and then report to results on shutdown, just so I can better quantify the actual time in our integration tests. I will let you know what I find. There are two additional TestExecutionListners in the Spring Boot project that also have hotspots, if you think this sort of profiling is useful, I can open an issue with them as well.
Comment From: sbrannen
There are two additional
TestExecutionListnersin the Spring Boot project that also have hotspots, if you think this sort of profiling is useful, I can open an issue with them as well.
If you feel that it would make a noticeable difference, feel free to raise issues in Spring Boot's issue tracker for those.
Comment From: tkvangorder
welp, the numbers don't lie. I replaced the TestContextManager with a TimingTestContextManager and then used micrometer to time each listener (for each test life cycle event). There are some interesting numbers in there...but it looks like adding my LRU actually proved to be a tiny bit slower...
Without Caching Method Caching:

beforeTestMethod TransactionalTestExecutionListener - Total Time : 7640.463782ms, Average : 15.280927563999999
beforeTestMethod TransactionalTestExecutionListener - Total Time : 7615.72956ms,  Average : 15.23145912
beforeTestMethod TransactionalTestExecutionListener - Total Time : 7495.947441ms, Average : 14.991894882
beforeTestMethod TransactionalTestExecutionListener - Total Time : 7338.232681ms, Average : 14.676465362
beforeTestMethod TransactionalTestExecutionListener - Total Time : 7412.853655ms, Average : 14.82570731


afterTestMethod TransactionalTestExecutionListener  - Total Time : 12541.935487ms, Average : 25.083870974
afterTestMethod TransactionalTestExecutionListener  - Total Time : 12707.862147ms, Average : 25.415724294
afterTestMethod TransactionalTestExecutionListener  - Total Time : 12053.314542ms, Average : 24.106629084
afterTestMethod TransactionalTestExecutionListener  - Total Time : 12053.398761ms, Average : 24.106797522
afterTestMethod TransactionalTestExecutionListener  - Total Time : 12275.033363ms, Average : 24.550066726

With Caching Method Caching:

beforeTestMethod CachingTransactionalTestExecutionListener - Total Time : 7310.722917ms, Average : 14.621445834
beforeTestMethod CachingTransactionalTestExecutionListener - Total Time : 7514.595977ms, Average : 15.029191954
beforeTestMethod CachingTransactionalTestExecutionListener - Total Time : 7633.312667ms, Average : 15.266625334
beforeTestMethod CachingTransactionalTestExecutionListener - Total Time : 7541.613264ms, Average : 15.083226527999999
beforeTestMethod CachingTransactionalTestExecutionListener - Total Time : 7468.670202ms, Average : 14.937340404


afterTestMethod CachingTransactionalTestExecutionListener - Total Time : 14198.265825ms, Average : 28.39653165
afterTestMethod CachingTransactionalTestExecutionListener - Total Time : 13669.103925ms, Average : 27.33820785
afterTestMethod CachingTransactionalTestExecutionListener - Total Time : 13982.139977ms, Average : 27.964279954000002
afterTestMethod CachingTransactionalTestExecutionListener - Total Time : 13297.927479ms, Average : 26.595854958
afterTestMethod CachingTransactionalTestExecutionListener - Total Time : 13512.967379ms, Average : 27.025934758
So my fix was "less than ideal". That being said, the TransactionalTestExecutionListener is the primary place where we lose some time: ~ 39ms per test.
We have approximately 8000 tests in our application, which is why we were trying to hunt this down. (Which equates to 5.2 minutes in our build) We have most of our tests inheriting from a base test class that applies the @Transactional at the class level, so this might be part of the problem.
Would you like me to close this issue?
Comment From: tkvangorder
Just to share my approach and results a bit further:
I added micrometer timers to the TextContextManager around each of the life-cycle events and then added a dimensional tag for each listener. I also added a shutdown hook to then print out the results. This is a sample from running one of our sub-models within our larger application. There were 2801 tests over 132 test classes:
It feels like a much better way to quantify the "real" time being spent in the listeners.
beforeTestMethod                          TransactionalTestExecutionListener - Total Time:    43043.972237ms, Count: 2801    , Mean:            15.367359ms, Max:    43.777842ms, Percentiles: ( 14.155776ms at 50%)( 14.680064ms at 75%)( 17.301504ms at 90%)
afterTestMethod                           TransactionalTestExecutionListener - Total Time:    80188.293163ms, Count: 2801    , Mean:            28.628452ms, Max:    93.000965ms, Percentiles: ( 25.165824ms at 50%)( 29.360128ms at 75%)( 34.603008ms at 90%)
Comment From: sbrannen
So my fix was "less than ideal".
In light of that and the presumption that most projects would not benefit from cached @BeforeTransaction and @AfterTransaction method lookups, I am closing this issue.
We have most of our tests inheriting from a base test class that applies the
@Transactionalat the class level, so this might be part of the problem.
Potentially, yes. I would do my best to only apply @Transactional to test classes that actually need test-managed transactions.
So, if a significant percentage of the test classes extending that transactional base class do not need test-managed transactions, I would strongly consider introducing a separate base class for the non-transactional test cases (if you even need a base class). Sometimes, custom composed annotations can take the place of base classes within a test suite.
Comment From: tkvangorder
Thanks for your time, I will let you know if I find anything else.
Comment From: tkvangorder
@sbrannen Removing the @Transactional from those tests:
With no @Transactional annotation on the tests:

beforeTestMethod                          TransactionalTestExecutionListener - Total Time:       18.310810ms, Count: 500     , Mean:             0.036622ms, Max:     3.608993ms, Percentiles: (  0.026112ms at 50%)(  0.036352ms at 75%)(  0.050688ms at 90%)
afterTestMethod                           TransactionalTestExecutionListener - Total Time:        3.875319ms, Count: 500     , Mean:             0.007751ms, Max:     0.194498ms, Percentiles: (  0.006016ms at 50%)(  0.008576ms at 75%)(  0.011648ms at 90%)

With @Transactional:

beforeTestMethod                          TransactionalTestExecutionListener - Total Time:     7493.116512ms, Count: 500     , Mean:            14.986233ms, Max:    74.469757ms, Percentiles: ( 14.155776ms at 50%)( 14.680064ms at 75%)( 17.301504ms at 90%)
afterTestMethod                           TransactionalTestExecutionListener - Total Time:    12650.305522ms, Count: 500     , Mean:            25.300611ms, Max:   206.193508ms, Percentiles: ( 22.020096ms at 50%)( 26.214400ms at 75%)( 29.360128ms at 90%)
Looks like we have some work to do to refactor things. Thanks again for your help , I like the idea of using a composed annotation.
Comment From: sbrannen
Glad to be of service, and thanks for providing the feedback.