A spring Boot 2.4.2, and Cloud 2020.0.2, microservice using WebFlux and New Relic, after a period of time: * Heap memory usage gets higher and higher * All memory is moved to the Old Gen * Garbage Collector takes a lot of CPU (due to full GC required to clean Old Gen) and application becomes unresponsive
The issue does not happen when New Relic is not included, no memory issues. These New Relic agent versions were tested and all presented the same issue over time: 5.8.0, 5.14.0 and 6.4.2
We can replicate this without fail via load testing over time. Eventually the service crashes, a Heap Dump was retrieved moments before the crash and analyzed using the Eclipse Memory Analyzer, and 260mb were being used by New Relic.
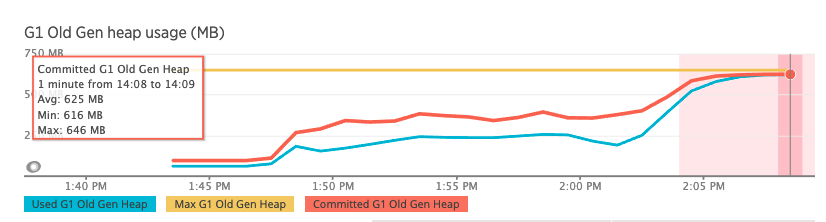
Image shows Old gen over time.
We can provide whatever further details are needed to resolve.
Comment From: bclozel
It seems that all the evidence you've gathered so far points to a memory leak in the New Relic agent itself. The heap dump should show what are the leaking instances and should help diagnose the issue.
Please raise this issue to the New Relic team; I'm closing this issue for now, but feel free to reopen it if it turns out the New Relic agent is not causing the issue.
Thanks!