This is an initial version of adding observability to the application context startup. We're providing an ObservabilityApplicationStartup that will create metrics and traces for the application context startup.
Things to discuss:
- key names for post processors and bean names
- do span names look ok
- does the tracing graph look useful
- do the metric names look fine
How to run this?
Build spring framework with the observability change
$ git clone git@github.com:marcingrzejszczak/spring-framework.git
$ cd spring-framework
$ git checkout observability_context
$ ./gradlew pTML -x dokkaHtmlPartial -x javadoc
Run zipkin
$ docker run -d -p 9411:9411 openzipkin/zipkin
Run sample
$ git clone git@github.com:marcingrzejszczak/observability-samples.git
$ cd observability-samples/spring-framework-startup-step
$ ./mvnw clean install
Go to zipkin and check the traces (you can find the links in the logs too)
To do:
- [ ] add tests
- [ ] refactor naming
Attachments:
Tracing
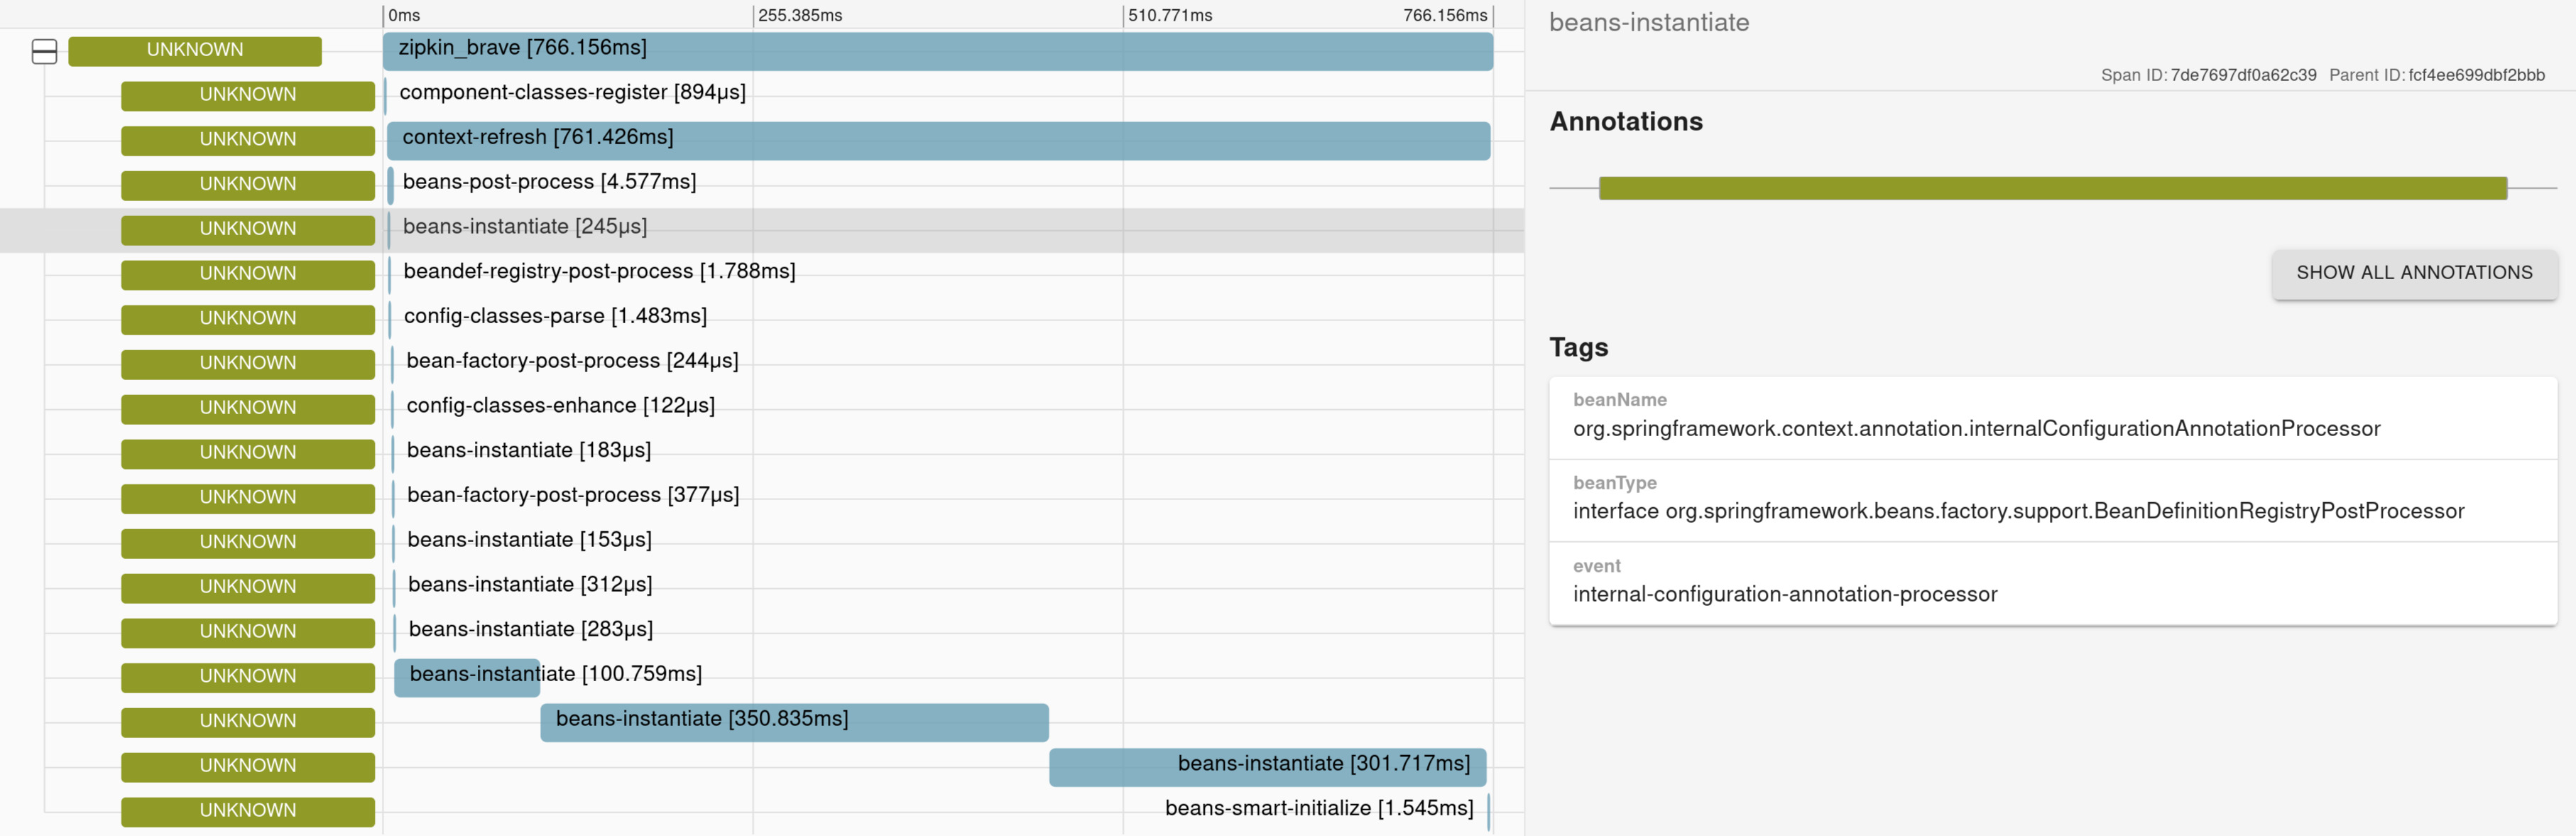
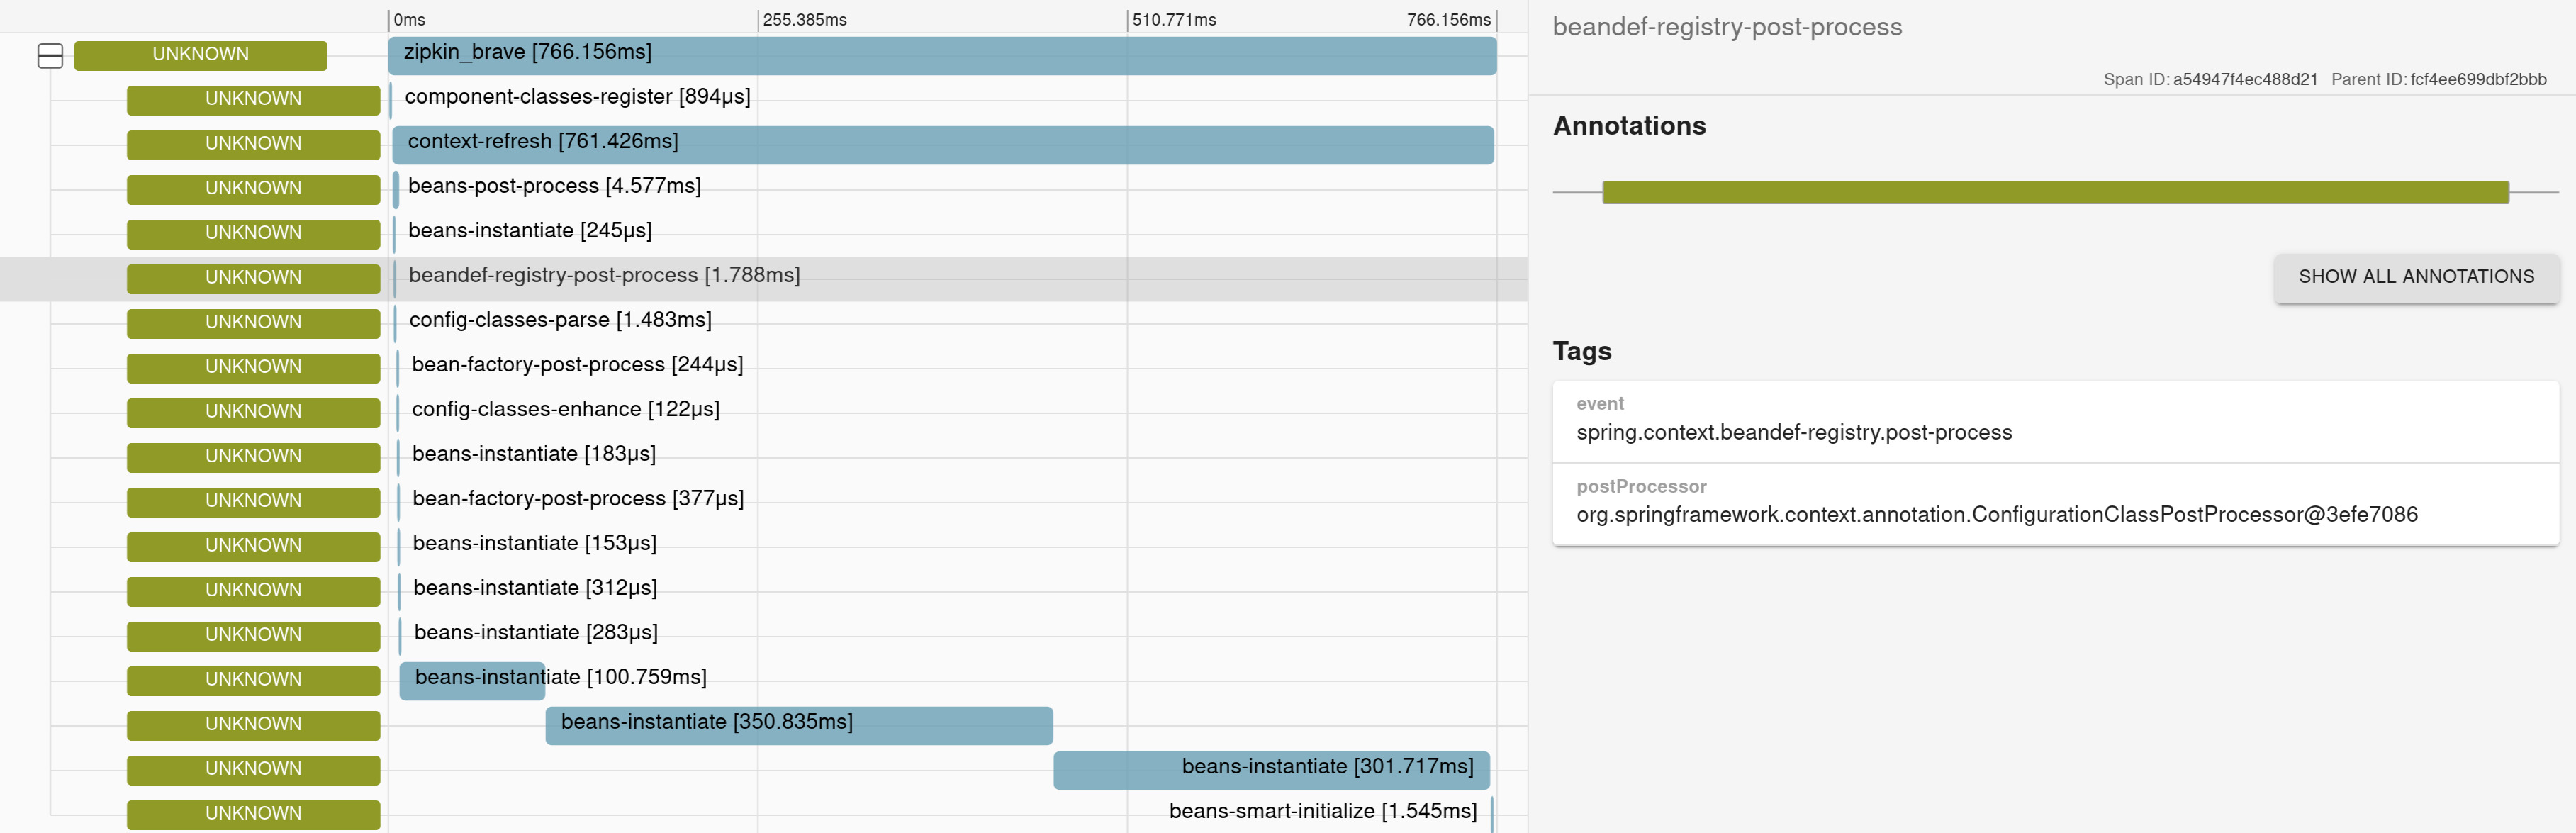
The long spans for 3 beans are because I've put thread sleep there.
Metrics
INFO: Gathered the following metrics
    Meter with name <component-classes-register> and type <TIMER> has the following measurements
        <[Measurement{statistic='COUNT', value=1.0}, Measurement{statistic='TOTAL_TIME', value=5.45248E-4}, Measurement{statistic='MAX', value=5.45248E-4}]>
        and has the following tags []
    Meter with name <config-classes-enhance> and type <TIMER> has the following measurements
        <[Measurement{statistic='COUNT', value=1.0}, Measurement{statistic='TOTAL_TIME', value=1.12475E-4}, Measurement{statistic='MAX', value=1.12475E-4}]>
        and has the following tags []
    Meter with name <context-refresh> and type <TIMER> has the following measurements
        <[Measurement{statistic='COUNT', value=1.0}, Measurement{statistic='TOTAL_TIME', value=0.758611286}, Measurement{statistic='MAX', value=0.758611286}]>
        and has the following tags []
    Meter with name <application-context> and type <TIMER> has the following measurements
        <[Measurement{statistic='COUNT', value=1.0}, Measurement{statistic='TOTAL_TIME', value=0.760485243}, Measurement{statistic='MAX', value=0.760485243}]>
        and has the following tags []
    Meter with name <config-classes-parse> and type <TIMER> has the following measurements
        <[Measurement{statistic='COUNT', value=1.0}, Measurement{statistic='TOTAL_TIME', value=0.001387312}, Measurement{statistic='MAX', value=0.001387312}]>
        and has the following tags []
    Meter with name <beans-smart-initialize> and type <TIMER> has the following measurements
        <[Measurement{statistic='COUNT', value=1.0}, Measurement{statistic='TOTAL_TIME', value=5.19617E-4}, Measurement{statistic='MAX', value=5.19617E-4}]>
        and has the following tags []
    Meter with name <bean-factory-post-process> and type <TIMER> has the following measurements
        <[Measurement{statistic='COUNT', value=2.0}, Measurement{statistic='TOTAL_TIME', value=5.60877E-4}, Measurement{statistic='MAX', value=3.00092E-4}]>
        and has the following tags []
    Meter with name <beans-instantiate> and type <TIMER> has the following measurements
        <[Measurement{statistic='COUNT', value=8.0}, Measurement{statistic='TOTAL_TIME', value=0.753513043}, Measurement{statistic='MAX', value=0.350868039}]>
        and has the following tags []
    Meter with name <beandef-registry-post-process> and type <TIMER> has the following measurements
        <[Measurement{statistic='COUNT', value=1.0}, Measurement{statistic='TOTAL_TIME', value=0.001651275}, Measurement{statistic='MAX', value=0.001651275}]>
        and has the following tags []
    Meter with name <beans-post-process> and type <TIMER> has the following measurements
        <[Measurement{statistic='COUNT', value=1.0}, Measurement{statistic='TOTAL_TIME', value=0.004167575}, Measurement{statistic='MAX', value=0.004167575}]>
        and has the following tags []
@shakuzen @jonatan-ivanov
Comment From: wilkinsona
Looking at the sample, how would this work in Boot where the MeterRegistry is created via auto-configuration? There's a chicken-and-egg problem that'll need to be solved somehow.
Comment From: bclozel
I haven't followed closely the latest discussions about the observability theme in Framework, so I'm probably missing a lot of context here. I'll try to list a few questions here to make progress on this PR.
ApplicationStartup is a very basic infrastructure to collect data during context startup - it does not replace a Java profiler nor proper metrics instrumentation. Different types of events are mixed and collected under String keys, with no support for tags nor proper measurements (taking into account GC behavior, for example). The main goal here is to provide a lightweight infrastructure, with zero dependency, that you can bootstrap with the application context. Because startup is very time-sensitive, our number one priority here is to avoid expensive operations or costly dependencies.
This data is still useful and could be collected for metrics purposes, this is why we've discussed how the BufferingApplicationStartup implementation could re-expose collected information for the metrics infrastructure (see spring-projects/spring-boot#27475).
To me, the first step towards observability integration in Spring Framework would be to target an existing metric where instrumentation can be considered quite convoluted (because done outside of Framework) and bake it in. If anything, I thought that the observability theme could deprecate ApplicationStartup in favor of targeted metrics with proper types (counter, gauges, distributions, etc).
I'm not seeing any new API for collecting metrics in Framework. Are we expecting to depend directly on Micrometer in the core Framework?
While "runtime metrics" can rely on a configured registry in the application context, I can see how collecting metrics before the application context is fully refreshed is a different problem and should be considered separately. Was this discussed already?
Comment From: marcingrzejszczak
Closing this for now. We'll look for a different way of instrumenting Framework other than the ApplicationStartupStep
Comment From: izeye
This seems to need to be removed from the milestone as it has been closed without changes.
Comment From: bclozel
Thanks @izeye