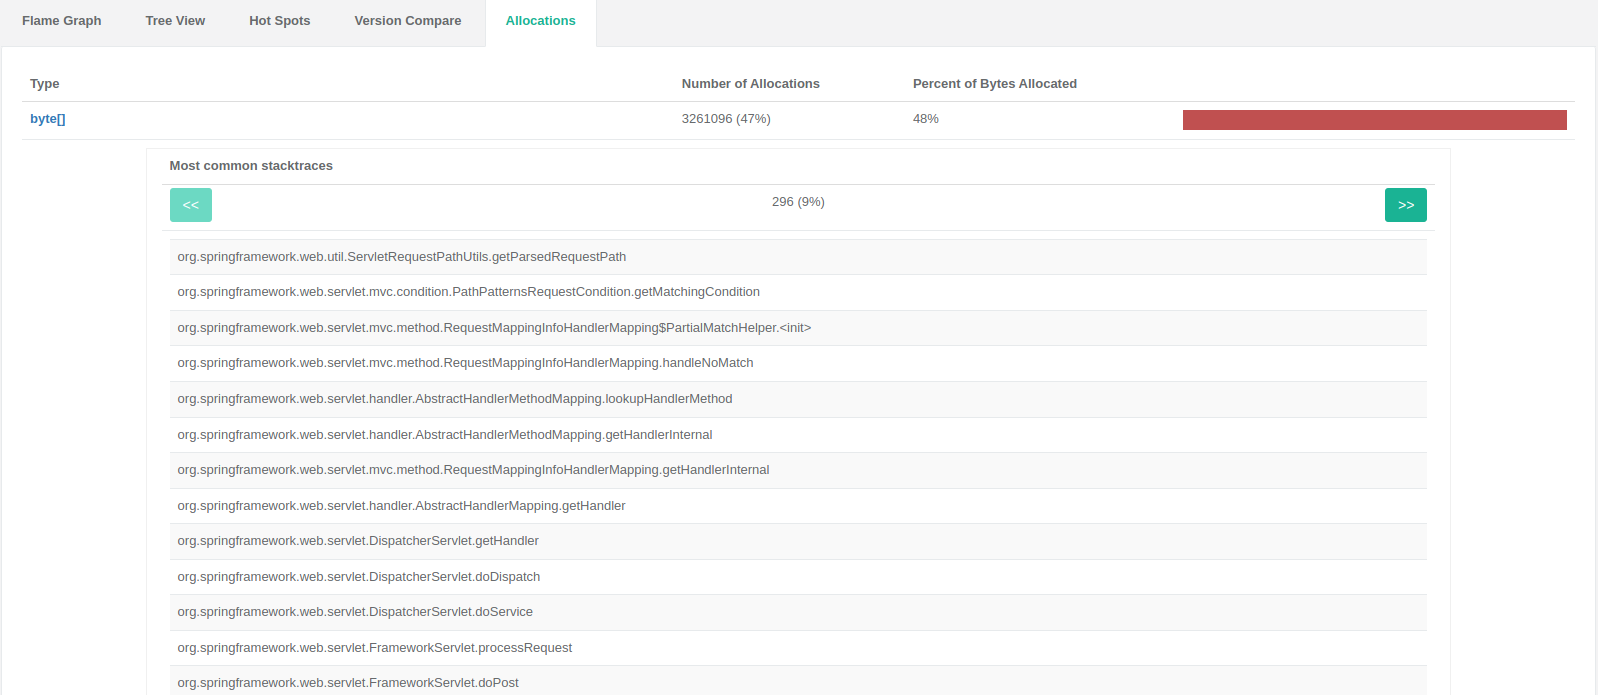
I noticed in Opsian Profiler, that somehow the org.springframework.web.util.ServletRequestPathUtils#getParsedRequestPath method in our services allocates memory everytime it is called. And it is called a lot.
For high RPM simple services, the memory allocation from it can be as significant as 30% total of all memory allocations.
The source code of ServletRequestPathUtils#getParsedRequestPath is:
    public static RequestPath getParsedRequestPath(ServletRequest request) {
        RequestPath path = (RequestPath) request.getAttribute(PATH_ATTRIBUTE);
        Assert.notNull(path, "Expected parsed RequestPath in request attribute \"" + PATH_ATTRIBUTE + "\".");
        return path;
    }
I would assume, the author expected the Expected parsed RequestPath in request attribute \"" + PATH_ATTRIBUTE + "\". to be compiled into a constant, however JD-GUI decompiler shows it still as:
Assert.notNull(path, "Expected parsed RequestPath in request attribute \"" + PATH_ATTRIBUTE + "\".");
The problem arises, because public static final String PATH_ATTRIBUTE = ServletRequestPathUtils.class.getName() + ".PATH"; is not a compile time constant, but a runtime constant.
So at least one, new, relatively long, and unnecessary, String is allocated every time this method is called.
One Profiler sample stacktrace (there are other stack branches):
I have seen lots of effort put under making Spring Boot more memory (allocation) efficient, in last 2 years, thank you for that. But it seems like there is an opportunity to make it even better.
Versions: Spring Boot 2.6.2. Spring Web 5.3.14.