Hi everyone, I created 2 Spring Webflux applications with the following version: spring-boot: 2.3.2.RELEASE spring-webflux: 5.2.8.RELEASE reactor-core: 3.3.8.RELEASE reactor-netty: 0.9.10.RELEASE
App1
@RestController
class DemoController(webClientBuilder: WebClient.Builder) {

    private val webClient = webClientBuilder.build()
    private val counter = AtomicLong(0)

    @GetMapping("/")
    fun demo(@RequestParam delay: Long): Mono<String> {
        return webClient.get()
            .uri("http://localhost:8080/delay?delay=$delay") // This calls App2
            .retrieve()
            .bodyToMono(String::class.java)
    }
}
App2
@RestController
class DelayController {
    @GetMapping("/delay")
    fun getUserWithDelay(@RequestParam delay: Long): Mono<String> {
        return Mono.just("OLOLO").delayElement(Duration.ofMillis(delay))
    }
}
Then I run some load test scenarios:
Scenario 1 (Expected) Users/Threads: 500 Target Throughput: 30k/min Delay: 1s
Result when calling directly to App2: Throughput: 500/s (expected because 30k/min ~ 500/s) Median Latency: 1s (expected because the delay is also 1s)
Result when calling to App1 -> App2: Throughput: 500/s (expected because 30k/min ~ 500/s) Median Latency: 1s (expected because the delay is also 1s)
Scenario 2 (App 1 slow, App2 expected) Users/Threads: 1000 Target Throughput: 60k/min Delay: 1s
Result when calling directly to App2: Throughput: 1k/s (expected because 60k/min ~ 1k/s) Median Latency: 1s (expected because the delay is also 1s)
Result when calling to App1 -> App2: Throughput: 500/s (expecting 1k/s) Median Latency: 2s (expecting 1s)
Scenario 3 (App1 slow, App2 expected) Users/Threads: 2000 Target Throughput: 60k/min Delay: 1s
Result when calling directly to App2: Throughput: 1k/s (expected because 60k/min ~ 1k/s) Median Latency: 1s (expected because the delay is also 1s)
Result when calling to App1 -> App2: Throughput: 500/s (expecting 1k/s) Median Latency: 4s (expecting 1s)
Summary It's causing higher latency and lower throughput when using WebClient (App1) with higher threads (>500) from jmeter
Any advice regarding this problem?
Comment From: rstoyanchev
Can you clarify what your testing environment is? Are they running on one or multiple nodes, etc?
Comment From: riko-traveloka
I'm running them all on my local machine one by one. Scenario 1 App 1 Scenario 1 App 2 Scenario 2 App 1 etc
My machine runs on: Ubuntu 16.04 LTS Intel(R) Core(TM) i7-6820HQ CPU @ 2.70GHz - 8 core RAM 16 GB
Comment From: rstoyanchev
Performance testing a multi-node environment on one computer will give you unhelpful results when you get into high numbers. In this scenario 1,000 users means 1,000 concurrent clients and 1,000 concurrent requests being handled each on app1 and app2 for a total of 3,000. Moreover depending on how many threads JMeter is configured to use that's likely causing heavy context switching.
Comment From: riko-traveloka
I did another testing similar to what I mentioned above, but I changed App 1 to use Jetty Server + Jetty Http Client (non-spring framework), and it performed as expected for scenario 1, 2, 3. The latency was consistent at around 1000ms, and the throughput was double than Spring Webflux.
Comment From: riko-traveloka
Here's the App 3 (Jetty Server + Jetty Http Client)
  public void delay(long delay, Callback<String> callback) throws IOException {
    HttpRequest httpRequest = new HttpRequest();
    httpRequest.setMethod(HttpMethod.GET);
    httpRequest.addHeader("Content-Type", "text/plain; charset=UTF-8");
    httpRequest.addHeader("Accept", "text/plain");
    httpRequest.setUrl("http://localhost:8080/delay?delay=" + delay); // This is App 2
    httpClient.sendAsync(httpRequest, new Callback<HttpResponse>() {
      @Override
      public void onException(Exception exception) {
        callback.onException(exception);
      }

      @Override
      public void onComplete(HttpResponse result) {
        callback.onComplete(
            StandardCharsets.UTF_8.decode(result.getBody().getByteBuffer()).toString()
        );
      }
    });
  }
And if I may summarize the scenario comparing App 1 VS App 3: Scenario 1 (Expected) Users/Threads: 500 Target Throughput: 30k/min Delay: 1s
Result when calling App1: Throughput: 500/s (expected because 30k/min ~ 500/s) Median Latency: 1s (expected because the delay is also 1s)
Result when calling App3: Throughput: 500/s (expected because 30k/min ~ 500/s) Median Latency: 1s (expected because the delay is also 1s)
Scenario 2 (App 1 slow, App3 expected) Users/Threads: 1000 Target Throughput: 60k/min Delay: 1s
Result when calling App1: Throughput: 500/s (expecting 1k/s) Median Latency: 2s (expecting 1s)
Result when calling App3: Throughput: 1k/s (expected because 60k/min ~ 1k/s) Median Latency: 1s (expected because the delay is also 1s)
Scenario 3 (App1 slow, App3 expected) Users/Threads: 2000 Target Throughput: 60k/min Delay: 1s
Result when calling App1: Throughput: 500/s (expecting 1k/s) Median Latency: 4s (expecting 1s)
Result when calling App3: Throughput: 1k/s (expected because 60k/min ~ 1k/s) Median Latency: 1s (expected because the delay is also 1s)
Comment From: rstoyanchev
You must have a copy and paste error. It's still showing 500/s for all 3 scenarios and 2s / 4s latency.
In any case, just because you see a difference with another server doesn't mean that the numbers are valid. I suggest at least separating client from server to be on different nodes.
Comment From: riko-traveloka
@rstoyanchev that's because for all 3 scenarios App 1 somehow consistently resulting with the same throughput ~500/s even though the latency increasing. Not sure why, but at least that's what I saw on Jmeter result.
Tbh I'm not sure separating client node from server node would have different result, since the environment on my local machine were exactly the same for both App 1 and App3. I did those tests several times and the result always the same. Also there's these two errors popping out once on App 1, but can't repro it again
Error1
2020-08-14 09:39:05.723 ERROR 18138 --- [or-http-epoll-2] reactor.core.publisher.Operators         : Operator called default onErrorDropped
java.lang.IllegalStateException: Only one connection receive subscriber allowed.
    at reactor.netty.channel.FluxReceive.subscribe(FluxReceive.java:175) [reactor-netty-0.9.10.RELEASE.jar!/:0.9.10.RELEASE]
    at reactor.core.publisher.InternalFluxOperator.subscribe(InternalFluxOperator.java:62) [reactor-core-3.3.8.RELEASE.jar!/:3.3.8.RELEASE]
    at reactor.netty.ByteBufFlux.subscribe(ByteBufFlux.java:327) [reactor-netty-0.9.10.RELEASE.jar!/:0.9.10.RELEASE]
    at reactor.core.publisher.InternalMonoOperator.subscribe(InternalMonoOperator.java:64) [reactor-core-3.3.8.RELEASE.jar!/:3.3.8.RELEASE]
    at reactor.core.publisher.MonoFlatMap$FlatMapMain.onNext(MonoFlatMap.java:150) [reactor-core-3.3.8.RELEASE.jar!/:3.3.8.RELEASE]
    at reactor.core.publisher.FluxSwitchIfEmpty$SwitchIfEmptySubscriber.onNext(FluxSwitchIfEmpty.java:67) [reactor-core-3.3.8.RELEASE.jar!/:3.3.8.RELEASE]
    at reactor.core.publisher.FluxOnAssembly$OnAssemblySubscriber.onNext(FluxOnAssembly.java:385) [reactor-core-3.3.8.RELEASE.jar!/:3.3.8.RELEASE]
    at reactor.core.publisher.FluxMap$MapSubscriber.onNext(FluxMap.java:114) [reactor-core-3.3.8.RELEASE.jar!/:3.3.8.RELEASE]
    at reactor.core.publisher.FluxPeek$PeekSubscriber.onNext(FluxPeek.java:192) [reactor-core-3.3.8.RELEASE.jar!/:3.3.8.RELEASE]
    at reactor.core.publisher.FluxPeek$PeekSubscriber.onNext(FluxPeek.java:192) [reactor-core-3.3.8.RELEASE.jar!/:3.3.8.RELEASE]
    at reactor.core.publisher.FluxPeek$PeekSubscriber.onNext(FluxPeek.java:192) [reactor-core-3.3.8.RELEASE.jar!/:3.3.8.RELEASE]
    at reactor.core.publisher.MonoNext$NextSubscriber.onNext(MonoNext.java:76) [reactor-core-3.3.8.RELEASE.jar!/:3.3.8.RELEASE]
    at reactor.core.publisher.Operators$ScalarSubscription.request(Operators.java:2344) [reactor-core-3.3.8.RELEASE.jar!/:3.3.8.RELEASE]
    at reactor.core.publisher.MonoFlatMapMany$FlatMapManyMain.onSubscribeInner(MonoFlatMapMany.java:143) [reactor-core-3.3.8.RELEASE.jar!/:3.3.8.RELEASE]
    at reactor.core.publisher.MonoFlatMapMany$FlatMapManyMain.onNext(MonoFlatMapMany.java:182) [reactor-core-3.3.8.RELEASE.jar!/:3.3.8.RELEASE]
    at reactor.core.publisher.SerializedSubscriber.onNext(SerializedSubscriber.java:99) [reactor-core-3.3.8.RELEASE.jar!/:3.3.8.RELEASE]
    at reactor.core.publisher.FluxRetryWhen$RetryWhenMainSubscriber.onNext(FluxRetryWhen.java:162) [reactor-core-3.3.8.RELEASE.jar!/:3.3.8.RELEASE]
    at reactor.core.publisher.MonoCreate$DefaultMonoSink.success(MonoCreate.java:156) [reactor-core-3.3.8.RELEASE.jar!/:3.3.8.RELEASE]
    at reactor.netty.http.client.HttpClientConnect$HttpIOHandlerObserver.onStateChange(HttpClientConnect.java:431) [reactor-netty-0.9.10.RELEASE.jar!/:0.9.10.RELEASE]
    at reactor.netty.ReactorNetty$CompositeConnectionObserver.onStateChange(ReactorNetty.java:514) [reactor-netty-0.9.10.RELEASE.jar!/:0.9.10.RELEASE]
    at reactor.netty.resources.PooledConnectionProvider$DisposableAcquire.onStateChange(PooledConnectionProvider.java:540) [reactor-netty-0.9.10.RELEASE.jar!/:0.9.10.RELEASE]
    at reactor.netty.resources.PooledConnectionProvider$PooledConnection.onStateChange(PooledConnectionProvider.java:427) [reactor-netty-0.9.10.RELEASE.jar!/:0.9.10.RELEASE]
    at reactor.netty.http.client.HttpClientOperations.onInboundNext(HttpClientOperations.java:574) [reactor-netty-0.9.10.RELEASE.jar!/:0.9.10.RELEASE]
    at reactor.netty.channel.ChannelOperationsHandler.channelRead(ChannelOperationsHandler.java:96) [reactor-netty-0.9.10.RELEASE.jar!/:0.9.10.RELEASE]
    at io.netty.channel.AbstractChannelHandlerContext.invokeChannelRead(AbstractChannelHandlerContext.java:379) [netty-transport-4.1.51.Final.jar!/:4.1.51.Final]
    at io.netty.channel.AbstractChannelHandlerContext.invokeChannelRead(AbstractChannelHandlerContext.java:365) [netty-transport-4.1.51.Final.jar!/:4.1.51.Final]
    at io.netty.channel.AbstractChannelHandlerContext.fireChannelRead(AbstractChannelHandlerContext.java:357) [netty-transport-4.1.51.Final.jar!/:4.1.51.Final]
    at io.netty.handler.codec.MessageToMessageDecoder.channelRead(MessageToMessageDecoder.java:103) [netty-codec-4.1.51.Final.jar!/:4.1.51.Final]
    at io.netty.channel.AbstractChannelHandlerContext.invokeChannelRead(AbstractChannelHandlerContext.java:379) [netty-transport-4.1.51.Final.jar!/:4.1.51.Final]
    at io.netty.channel.AbstractChannelHandlerContext.invokeChannelRead(AbstractChannelHandlerContext.java:365) [netty-transport-4.1.51.Final.jar!/:4.1.51.Final]
    at io.netty.channel.AbstractChannelHandlerContext.fireChannelRead(AbstractChannelHandlerContext.java:357) [netty-transport-4.1.51.Final.jar!/:4.1.51.Final]
    at io.netty.channel.CombinedChannelDuplexHandler$DelegatingChannelHandlerContext.fireChannelRead(CombinedChannelDuplexHandler.java:436) [netty-transport-4.1.51.Final.jar!/:4.1.51.Final]
    at io.netty.handler.codec.ByteToMessageDecoder.fireChannelRead(ByteToMessageDecoder.java:324) [netty-codec-4.1.51.Final.jar!/:4.1.51.Final]
    at io.netty.handler.codec.ByteToMessageDecoder.fireChannelRead(ByteToMessageDecoder.java:311) [netty-codec-4.1.51.Final.jar!/:4.1.51.Final]
    at io.netty.handler.codec.ByteToMessageDecoder.callDecode(ByteToMessageDecoder.java:425) [netty-codec-4.1.51.Final.jar!/:4.1.51.Final]
    at io.netty.handler.codec.ByteToMessageDecoder.channelRead(ByteToMessageDecoder.java:276) [netty-codec-4.1.51.Final.jar!/:4.1.51.Final]
    at io.netty.channel.CombinedChannelDuplexHandler.channelRead(CombinedChannelDuplexHandler.java:251) [netty-transport-4.1.51.Final.jar!/:4.1.51.Final]
    at io.netty.channel.AbstractChannelHandlerContext.invokeChannelRead(AbstractChannelHandlerContext.java:379) [netty-transport-4.1.51.Final.jar!/:4.1.51.Final]
    at io.netty.channel.AbstractChannelHandlerContext.invokeChannelRead(AbstractChannelHandlerContext.java:365) [netty-transport-4.1.51.Final.jar!/:4.1.51.Final]
    at io.netty.channel.AbstractChannelHandlerContext.fireChannelRead(AbstractChannelHandlerContext.java:357) [netty-transport-4.1.51.Final.jar!/:4.1.51.Final]
    at io.netty.channel.DefaultChannelPipeline$HeadContext.channelRead(DefaultChannelPipeline.java:1410) [netty-transport-4.1.51.Final.jar!/:4.1.51.Final]
    at io.netty.channel.AbstractChannelHandlerContext.invokeChannelRead(AbstractChannelHandlerContext.java:379) [netty-transport-4.1.51.Final.jar!/:4.1.51.Final]
    at io.netty.channel.AbstractChannelHandlerContext.invokeChannelRead(AbstractChannelHandlerContext.java:365) [netty-transport-4.1.51.Final.jar!/:4.1.51.Final]
    at io.netty.channel.DefaultChannelPipeline.fireChannelRead(DefaultChannelPipeline.java:919) [netty-transport-4.1.51.Final.jar!/:4.1.51.Final]
    at io.netty.channel.epoll.AbstractEpollStreamChannel$EpollStreamUnsafe.epollInReady(AbstractEpollStreamChannel.java:792) [netty-transport-native-epoll-4.1.51.Final-linux-x86_64.jar!/:4.1.51.Final]
    at io.netty.channel.epoll.EpollEventLoop.processReady(EpollEventLoop.java:475) [netty-transport-native-epoll-4.1.51.Final-linux-x86_64.jar!/:4.1.51.Final]
    at io.netty.channel.epoll.EpollEventLoop.run(EpollEventLoop.java:378) [netty-transport-native-epoll-4.1.51.Final-linux-x86_64.jar!/:4.1.51.Final]
    at io.netty.util.concurrent.SingleThreadEventExecutor$4.run(SingleThreadEventExecutor.java:989) [netty-common-4.1.51.Final.jar!/:4.1.51.Final]
    at io.netty.util.internal.ThreadExecutorMap$2.run(ThreadExecutorMap.java:74) [netty-common-4.1.51.Final.jar!/:4.1.51.Final]
    at io.netty.util.concurrent.FastThreadLocalRunnable.run(FastThreadLocalRunnable.java:30) [netty-common-4.1.51.Final.jar!/:4.1.51.Final]
    at java.lang.Thread.run(Thread.java:748) [na:1.8.0_265]
Error2
2020-08-14 09:39:21.584 ERROR 18138 --- [or-http-epoll-6] io.netty.util.ResourceLeakDetector       : LEAK: ByteBuf.release() was not called before it's garbage-collected. See https://netty.io/wiki/reference-counted-objects.html for more information.
Recent access records:
Created at:
    io.netty.buffer.PooledByteBufAllocator.newDirectBuffer(PooledByteBufAllocator.java:363)
    io.netty.buffer.AbstractByteBufAllocator.directBuffer(AbstractByteBufAllocator.java:187)
    io.netty.buffer.AbstractByteBufAllocator.directBuffer(AbstractByteBufAllocator.java:178)
    io.netty.buffer.AbstractByteBufAllocator.buffer(AbstractByteBufAllocator.java:115)
    org.springframework.core.io.buffer.NettyDataBufferFactory.allocateBuffer(NettyDataBufferFactory.java:71)
    org.springframework.core.io.buffer.NettyDataBufferFactory.allocateBuffer(NettyDataBufferFactory.java:39)
    org.springframework.core.codec.CharSequenceEncoder.encodeValue(CharSequenceEncoder.java:91)
    org.springframework.core.codec.CharSequenceEncoder.lambda$encode$0(CharSequenceEncoder.java:75)
    reactor.core.publisher.FluxMapFuseable$MapFuseableSubscriber.onNext(FluxMapFuseable.java:107)
    reactor.core.publisher.Operators$MonoSubscriber.complete(Operators.java:1782)
    reactor.core.publisher.MonoFlatMap$FlatMapInner.onNext(MonoFlatMap.java:241)
    reactor.core.publisher.FluxOnAssembly$OnAssemblySubscriber.onNext(FluxOnAssembly.java:385)
    reactor.core.publisher.FluxMapFuseable$MapFuseableSubscriber.onNext(FluxMapFuseable.java:121)
    reactor.core.publisher.FluxContextStart$ContextStartSubscriber.onNext(FluxContextStart.java:96)
    reactor.core.publisher.FluxMapFuseable$MapFuseableConditionalSubscriber.onNext(FluxMapFuseable.java:287)
    reactor.core.publisher.FluxFilterFuseable$FilterFuseableConditionalSubscriber.onNext(FluxFilterFuseable.java:330)
    reactor.core.publisher.Operators$MonoSubscriber.complete(Operators.java:1782)
    reactor.core.publisher.MonoCollect$CollectSubscriber.onComplete(MonoCollect.java:152)
    reactor.core.publisher.FluxMap$MapSubscriber.onComplete(FluxMap.java:136)
    reactor.core.publisher.FluxPeek$PeekSubscriber.onComplete(FluxPeek.java:252)
    reactor.core.publisher.FluxMap$MapSubscriber.onComplete(FluxMap.java:136)
    reactor.netty.channel.FluxReceive.onInboundComplete(FluxReceive.java:378)
    reactor.netty.channel.ChannelOperations.onInboundComplete(ChannelOperations.java:373)
    reactor.netty.channel.ChannelOperations.terminate(ChannelOperations.java:429)
    reactor.netty.http.client.HttpClientOperations.onInboundNext(HttpClientOperations.java:625)
    reactor.netty.channel.ChannelOperationsHandler.channelRead(ChannelOperationsHandler.java:96)
    io.netty.channel.AbstractChannelHandlerContext.invokeChannelRead(AbstractChannelHandlerContext.java:379)
    io.netty.channel.AbstractChannelHandlerContext.invokeChannelRead(AbstractChannelHandlerContext.java:365)
    io.netty.channel.AbstractChannelHandlerContext.fireChannelRead(AbstractChannelHandlerContext.java:357)
    io.netty.handler.codec.MessageToMessageDecoder.channelRead(MessageToMessageDecoder.java:103)
    io.netty.channel.AbstractChannelHandlerContext.invokeChannelRead(AbstractChannelHandlerContext.java:379)
    io.netty.channel.AbstractChannelHandlerContext.invokeChannelRead(AbstractChannelHandlerContext.java:365)
    io.netty.channel.AbstractChannelHandlerContext.fireChannelRead(AbstractChannelHandlerContext.java:357)
    io.netty.channel.CombinedChannelDuplexHandler$DelegatingChannelHandlerContext.fireChannelRead(CombinedChannelDuplexHandler.java:436)
    io.netty.handler.codec.ByteToMessageDecoder.fireChannelRead(ByteToMessageDecoder.java:324)
    io.netty.handler.codec.ByteToMessageDecoder.channelRead(ByteToMessageDecoder.java:296)
    io.netty.channel.CombinedChannelDuplexHandler.channelRead(CombinedChannelDuplexHandler.java:251)
    io.netty.channel.AbstractChannelHandlerContext.invokeChannelRead(AbstractChannelHandlerContext.java:379)
    io.netty.channel.AbstractChannelHandlerContext.invokeChannelRead(AbstractChannelHandlerContext.java:365)
    io.netty.channel.AbstractChannelHandlerContext.fireChannelRead(AbstractChannelHandlerContext.java:357)
    io.netty.channel.DefaultChannelPipeline$HeadContext.channelRead(DefaultChannelPipeline.java:1410)
    io.netty.channel.AbstractChannelHandlerContext.invokeChannelRead(AbstractChannelHandlerContext.java:379)
    io.netty.channel.AbstractChannelHandlerContext.invokeChannelRead(AbstractChannelHandlerContext.java:365)
    io.netty.channel.DefaultChannelPipeline.fireChannelRead(DefaultChannelPipeline.java:919)
    io.netty.channel.epoll.AbstractEpollStreamChannel$EpollStreamUnsafe.epollInReady(AbstractEpollStreamChannel.java:792)
    io.netty.channel.epoll.EpollEventLoop.processReady(EpollEventLoop.java:475)
    io.netty.channel.epoll.EpollEventLoop.run(EpollEventLoop.java:378)
    io.netty.util.concurrent.SingleThreadEventExecutor$4.run(SingleThreadEventExecutor.java:989)
    io.netty.util.internal.ThreadExecutorMap$2.run(ThreadExecutorMap.java:74)
    io.netty.util.concurrent.FastThreadLocalRunnable.run(FastThreadLocalRunnable.java:30)
    java.lang.Thread.run(Thread.java:748)
Comment From: rstoyanchev
Tbh I'm not sure separating client node from server node would have different result
You have not yet mentioned how many threads JMeter is configured to use (i.e. level of concurrency rather than number of clients). If the thread count is high that interferes with the event loop concurrency model that the servers rely on which by contrast uses a small number of threads closer to the number of cores.
the environment on my local machine were exactly the same for both App 1 and App3.
I am not saying that the environment isn't the same but rather that the same environment can yield misleading results with the difference coming down to something unrelated to what actually happens in an environment where clients and servers aren't competing for resources on the same hardware and where network latency introduces different variability.
Note that the Jetty snippet above is not an apples to apples comparison. It is more or less just a server and different from what an actual application looks like. In the WebFlux case you have a web framework with annotations-based routing, a layer of codecs, and so on. All of that adds additional work that could be impacted very differently under high load, especially with a high number of threads, which alone makes the performance setup invalid.
We get a lot of reports and if you want to increase your chance of us spending time on it, try to eliminate as much as possible any proving or disproving that we have to do before deciding if there is something to fix.
Comment From: riko-traveloka
I already put jmeter thread there, the Users/threads above Target throughputs in every scenario. Sorry I didn't specifically wrote jmeter thread there.
It's not apple to apple, but I expect the performance will not be that different, and even expecting spring webflux is better, hence I'm benchmarking it to move to webflux.
I find it weird with the number presented to me from jmeter. Somehow the throughput for App1 was consistent to be 500/s. Somehow the latency is doubling if I double the threads, tripling if I triple the threads, but the throughput always 500/s. As if the system call App2 multiple times in 1 request
Anyway, I'll get back once I test on dedicated node for the client and server.
Comment From: rstoyanchev
Okay so it is 1,000 concurrent and 2,000 concurrent threads. That is a completely invalid setup to run all that and the severs on the same hardware.
You might want to read https://jmeter.apache.org/usermanual/best-practices.html#sizing_threads:
As with any Load Testing tool, if you don't correctly size the number of threads, you will face the "Coordinated Omission" problem which can give you wrong or inaccurate results. If you need large-scale load testing, consider running multiple CLI JMeter instances on multiple machines using distributed mode (or not).
That goes even further to suggest splitting clients across multiple machines.
Comment From: riko-traveloka
@rstoyanchev Sorry I haven't tested splitting those App into different machine, but I tried downgrading App1 to use spring boot 2.1.16, while App2 keep using spring boot 2.3.2 and run the same tests again on the same hardware, and the result is very good.
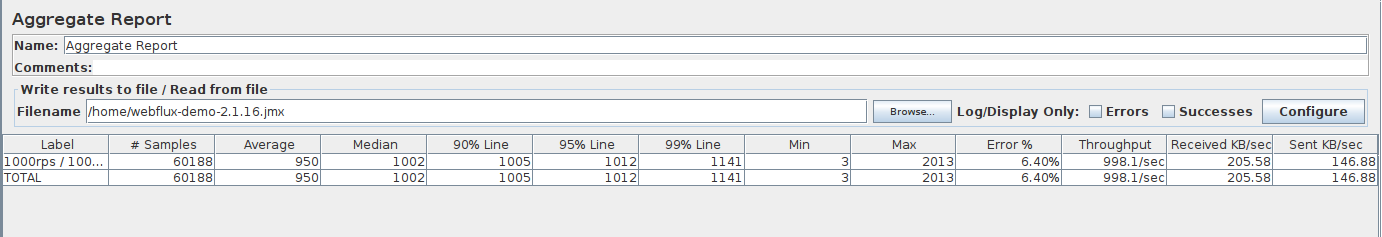
With 1000 jmeter thread, 1s delay, target throughput 60k/min: Throughput = ~1000/s Latency = ~1s
With 2000 jmeter thread, 1s delay, target throughput 120k/min: Throughput = ~1800/s Latency = ~1s
Here's the version I used: spring-boot: 2.1.16.RELEASE spring-webflux: 5.1.17.RELEASE reactor-core: 3.2.19.RELEASE reactor-netty: 0.8.20.RELEASE
So in those test cases I performed, running jmeter, App1, App2 on the same hardware have different results when I use spring boot 2.3.2 VS spring boot 2.1.16 on App1. Which spring boot 2.1.16 performed much better than 2.3.2.
I also tested using spring-boot 2.2.9, 2.2.7, 2.2.0, but the performance is the same like 2.3.2. Do you think we can take it as a valid problem? Because the only difference here is the spring-boot version and it's dependencies, the other factors are the same.
Comment From: riko-traveloka
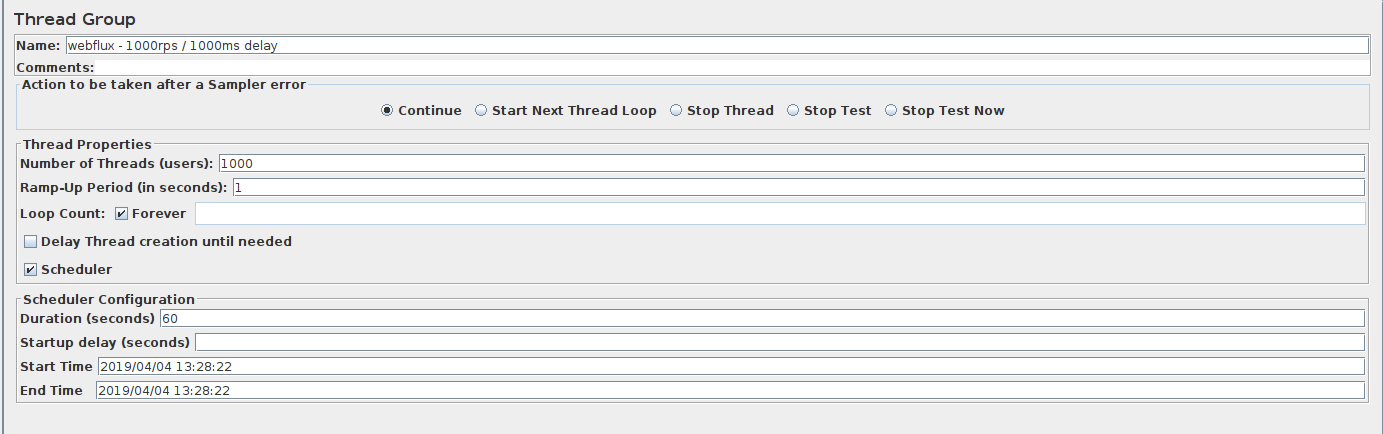
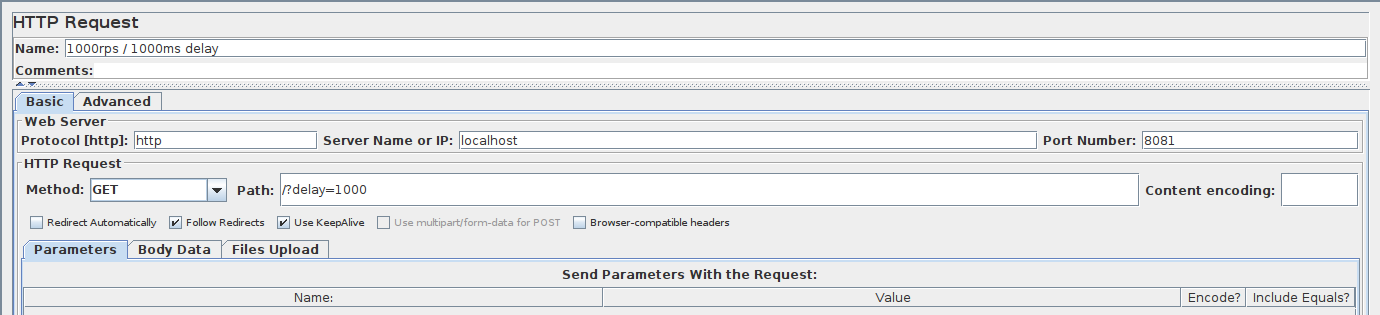
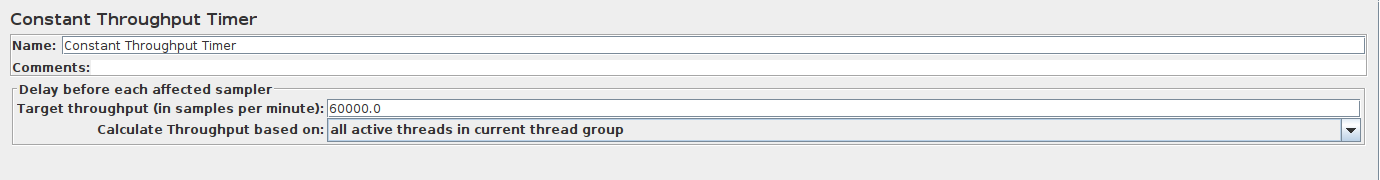
Below are some screenshots from jmeter
JMeter setup
JMeter result using spring-boot 2.3.2
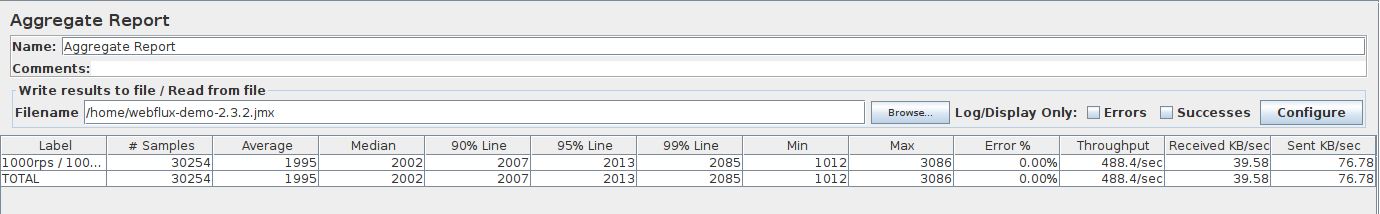
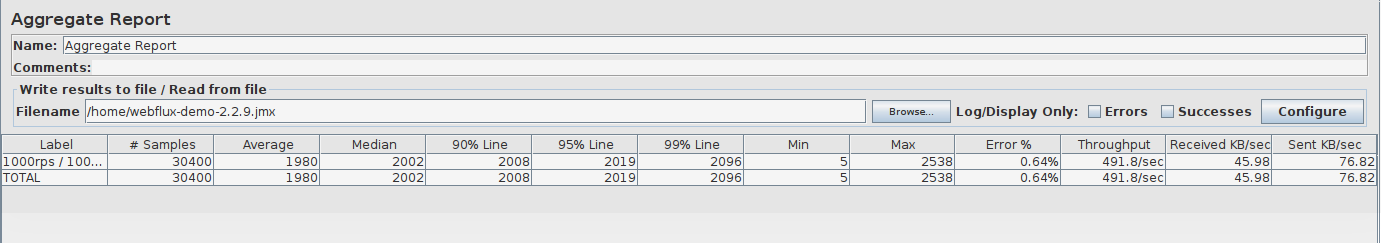
JMeter result using spring-boot 2.2.9
JMeter result using spring-boot 2.1.16
Comment From: riko-traveloka
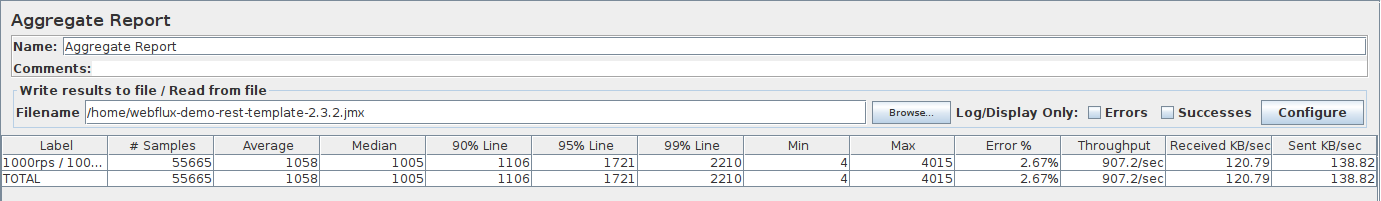
I modified App1 using spring-boot 2.3.2 and rest template, and the result is much better than using WebClient. Here's the code and screenshot from jmeter
App1 with rest template
@RestController
class DemoController() {
    private val restTemplate = RestTemplate()

    @GetMapping("/")
    fun demo(@RequestParam delay: Long): Mono<String> {
        return Mono.defer {
            Mono.just(restTemplate.getForEntity("http://localhost:8080/delay?delay=$delay", String::class.java).body!!)
        }.subscribeOn(Schedulers.elastic())
    }
}
Jmeter result
Comment From: riko-traveloka
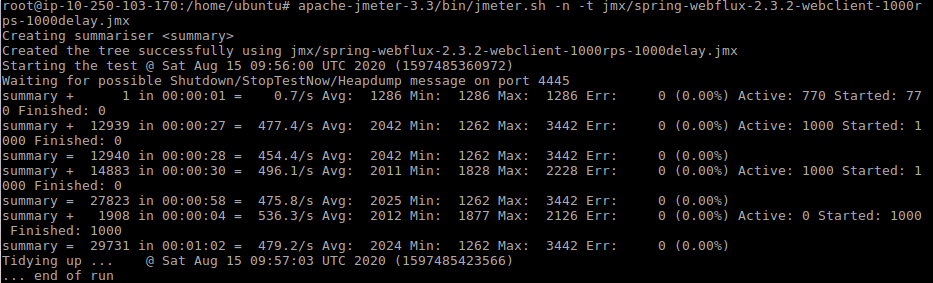
@rstoyanchev Just managed to split each app and jmeter runner into separate node on aws. Here's the setup: Jmeter runner: t3.small App1 (using 2.3.2 + WebClient): t3.small App1 (using 2.1.16 + WebClient): t3.small App2 (using 2.3.2): t3.small
The jmeter setup is the same like before: Thread: 1000 Delay: 1s Target Throughput: 60k/min
Here's Jmeter result for App1 (using 2.3.2 + WebClient)
Here's Jmeter result for App1 (using 2.1.16 + WebClient)
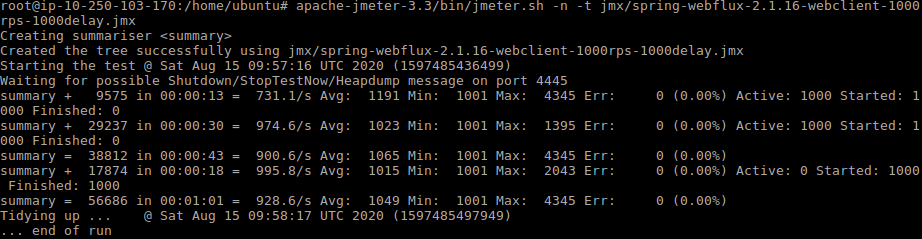
As you can see from the screenshots, the result is similar with what I tried on my machine.
Here's the github links: App1 (2.3.2): https://github.com/riko-traveloka/spring-webflux-app-demo App1 (2.1.16): https://github.com/riko-traveloka/spring-webflux-app-demo/tree/spring-boot-2.1.16-webclient App2: https://github.com/riko-traveloka/spring-webflux-delay-demo
Comment From: riko-traveloka
Turns out the slow throughput because on version >= 2.2.x, spring webclient uses reactor-netty 0.9.x that implement default connection limit to 500. After changing the connection limit, the throughput improves a lot. I'll close this ticket
Comment From: bclozel
Thanks for letting us know @riko-traveloka
Comment From: vivek1082
we are facing similar issue while doing perf test via jmeter, what was the connection limit you changed to ?? @riko-traveloka