My project using spring version 4.3.11.Release and i can see huge memory leakage in DefaultListableBeanFactory. We are not using any LinkedList, But it looks like spring defaultListableBeanFactory using internally and is not getting garbage collected
Please let me know, how to fix this issue and it would be really helpful
One instance of "org.springframework.beans.factory.support.DefaultListableBeanFactory" loaded by "org.apache.catalina.loader.ParallelWebappClassLoader @ 0x4c00ef4f0" occupies 220,844,344 (15.97%) bytes. The memory is accumulated in one instance of "java.util.LinkedList" loaded by "
Comment From: snicoll
@johnpalantir 4.3.11.RELEASE was released almost 3 years ago. If that's a bug in the Spring Framework, it is very much likely that the issue has been reported and fixed in the meantime. The latest release in the 4.3.x line is 4.3.28.RELEASE so please upgrade to that first.
If that doesn't fix your issue and If you want support from us, you'll have to share more details about the problem, ideally in the form of a small sample that we can run to reproduce the problem.
Comment From: johnpalantir
Thanks for prompt response @snicoll What DefaultListableBeanFactory is all about? I am not able to find much information on the internet for the same
Comment From: jhoeller
DefaultListableBeanFactory is the internal container for a Spring ApplicationContext, managing the bean instances for a particular application or service. If you can reproduce this against a recent Spring Framework version, please let us know, we'll try to find out where it comes from then. We have some known memory leaks in the EJB container support but not in standard Spring setups.
Comment From: vprasanna80
We are using the following versions of Spring in our code base and found this issue as well. It is causing an out of memory error, upon heap-dump analysis it is clearly evident due to DefaultListBeanFactory class.
   <spring.version>5.1.10.RELEASE</spring.version>
   <spring-boot.version>2.1.12.RELEASE</spring-boot.version>
Comment From: snicoll
Closing due to the lack of feedback.
Comment From: hassibnkhoury
so what is the solution? i am using the latest version of spring boot 3.2.1 and still the issue of memory appears: One instance of “org.springframework.beans.factory.support.DefaultListableBeanFactory” loaded by “org.springframework.boot.loader.launch.LaunchedClassLoader @ 0xf006e300” occupies 1,025,792 (11.57%) bytes. The memory is accumulated in one instance of “org.springframework.beans.factory.support.DefaultListableBeanFactory”, loaded by “org.springframework.boot.loader.launch.LaunchedClassLoader @ 0xf006e300”, which occupies 1,025,792 (11.57%) bytes.
Keywords org.springframework.beans.factory.support.DefaultListableBeanFactory org.springframework.boot.loader.launch.LaunchedClassLoader
Comment From: bclozel
Can you share a small sample that reproduces the problem?
Comment From: hassibnkhoury
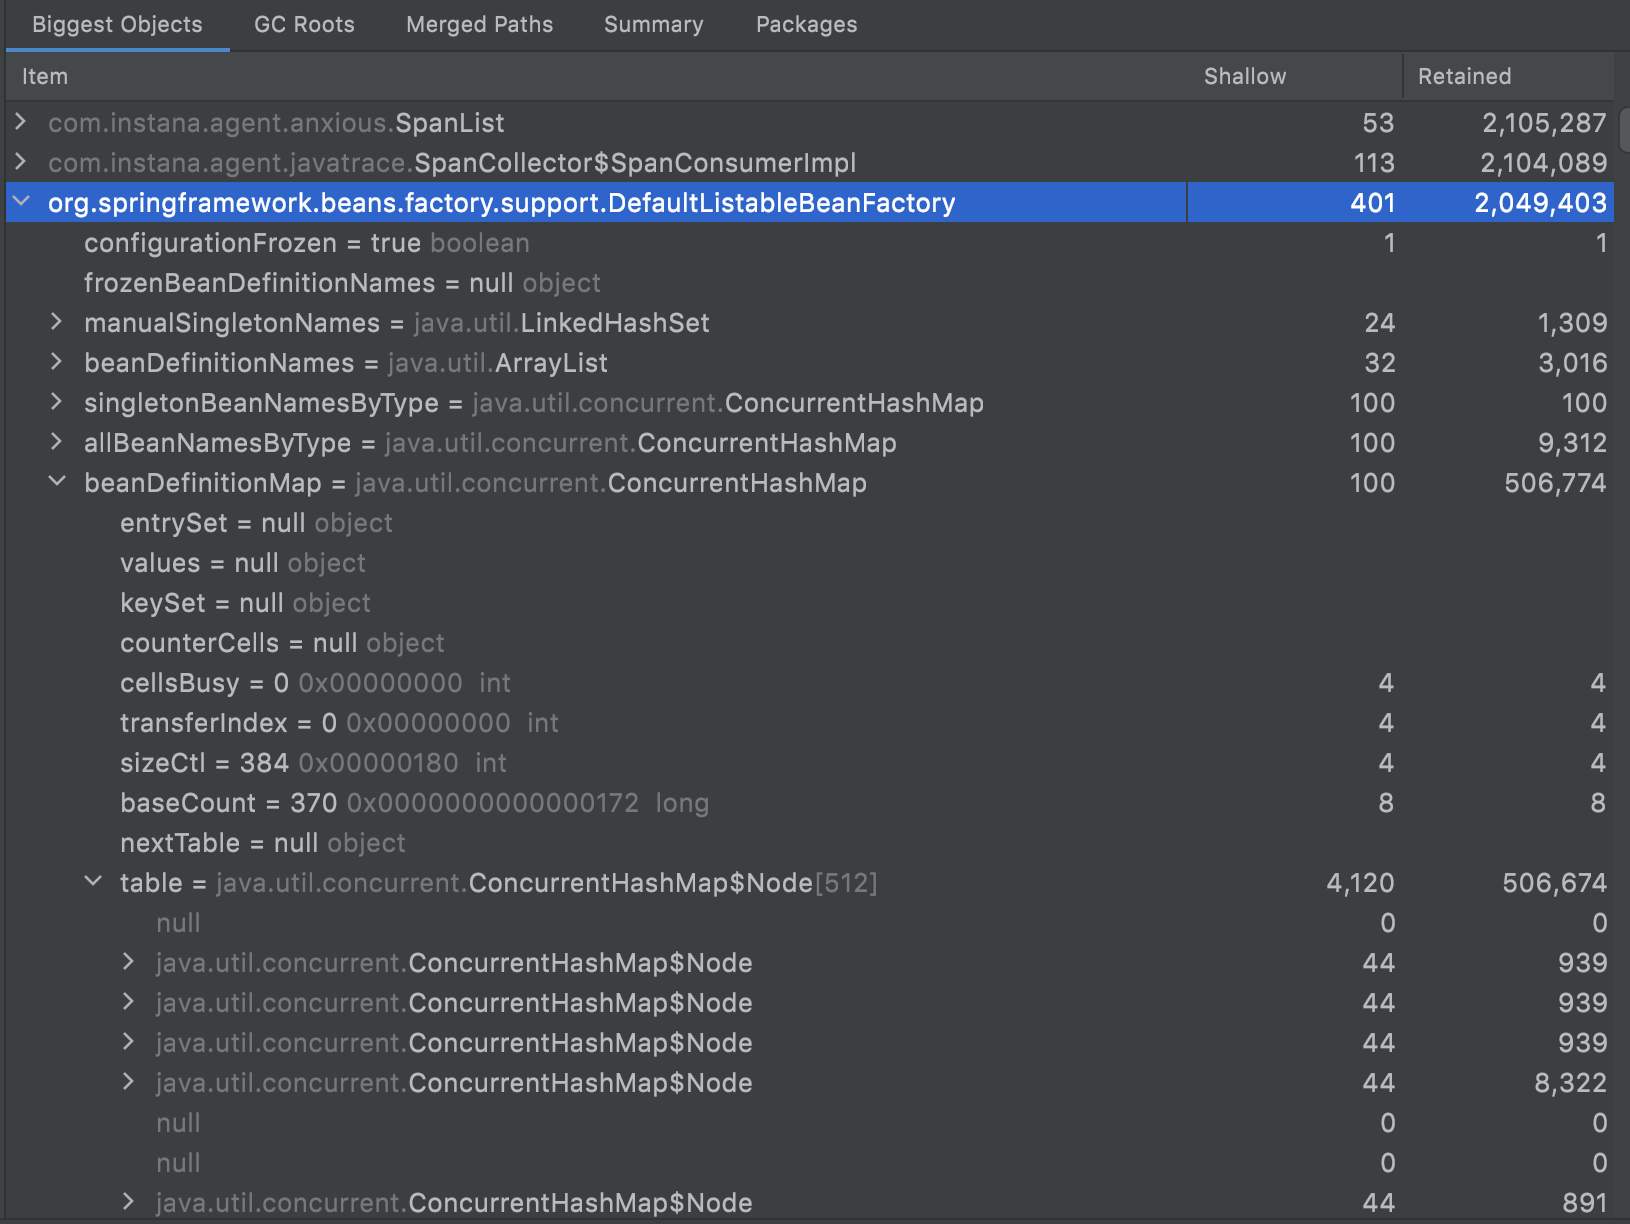
Hello bclozel, I am using spring boot application release 3.2.1(latest) and I am using MAT(Memory Analyzer Tool) to resolve the memory performance and i got the below issue related to this 25619 :
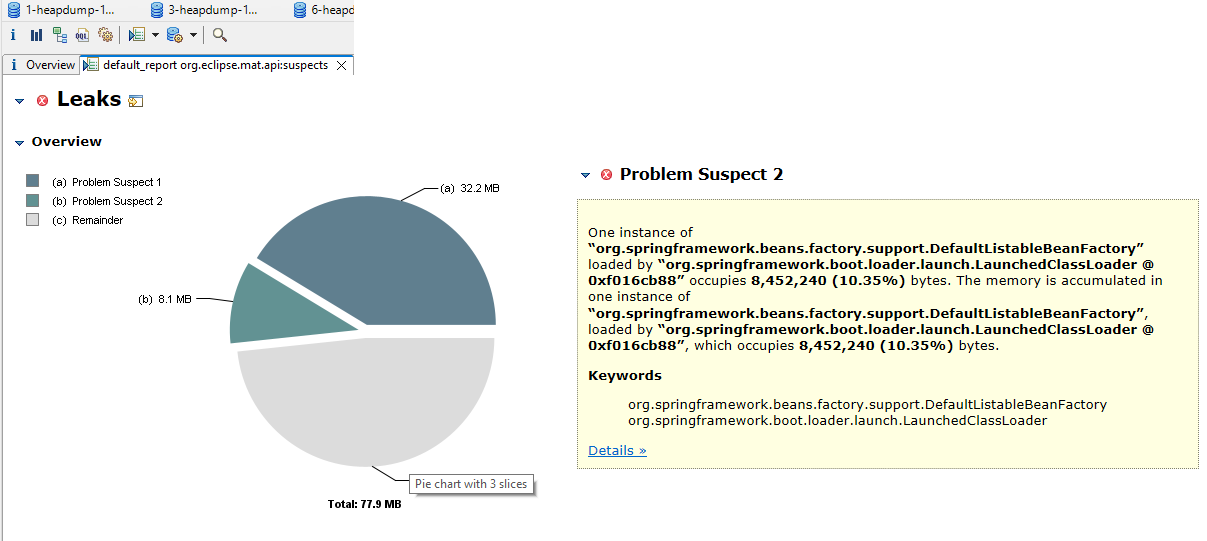
One instance of “org.springframework.beans.factory.support.DefaultListableBeanFactory” loaded by “org.springframework.boot.loader.launch.LaunchedClassLoader @ 0xf016cb88” occupies 8,452,240 (10.35%) bytes. The memory is accumulated in one instance of “org.springframework.beans.factory.support.DefaultListableBeanFactory”, loaded by “org.springframework.boot.loader.launch.LaunchedClassLoader @ 0xf016cb88”, which occupies 8,452,240 (10.35%) bytes.
Keywords
org.springframework.beans.factory.support.DefaultListableBeanFactory
org.springframework.boot.loader.launch.LaunchedClassLoader
Comment From: bclozel
This report merely states that this class is a suspect because it holds a large amount of memory. Why do you think there is a leak here? The bean factory holds large parts of your application. As Juergen mentioned above:
DefaultListableBeanFactory is the internal container for a Spring ApplicationContext, managing the bean instances for a particular application or service.
Maybe using 10% of the memory to manage your entire application is expected? I would suggest getting more familiar with your tool to better understand if and where there is a memory leak. Maybe take several snapshots at runtime and see where the memory is growing unexpectedly? In any case, there isn't anything showing that there is a Spring issue right now.
Also, please refrain from adding comments all over the place on closed issues, this is not helping.
Comment From: hassibnkhoury
Noted for last point,
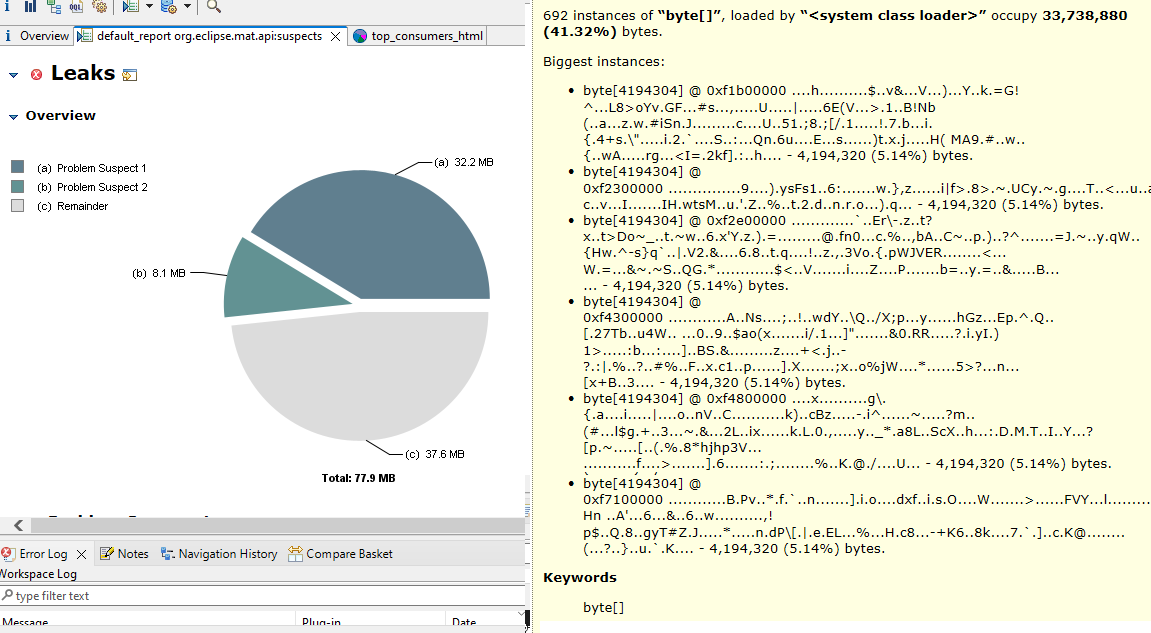
if i have another issue related to memory leak of byte[] as you see below: