Have a running app since 3 years in production without any issue. Experienced a memory leak when bumped Spring dependencies and have now traced it down to a single library: spring-webflux 6.1.1 -> 6.1.2 (no other code change)
It seems like their is a circular dependency between ClientRequestObservationContext and ClientRequest.Builder that cannot be garbage collected. The behaviour is deterministic in the sense that I managed to recreate the issue multiple times, it takes a couple of hours before running out of heap space. One instance of the application is quite heavy used with 50-100 requests / s and lots of downstream calls to other MicroServices using WebClient where the issue seems to be.
Changes that I think could be related: - https://github.com/spring-projects/spring-framework/commit/b87852612b642c296d3528cc8a39e12ac823235c#diff-3eb216adea96b2aa6651e8b1522b4c6b18a5271698d4478ac7b920eb90bbdfbe - https://github.com/spring-projects/spring-framework/issues/31702
Please let me know if I can provide more information, first time posting a bug report here.
// Erik
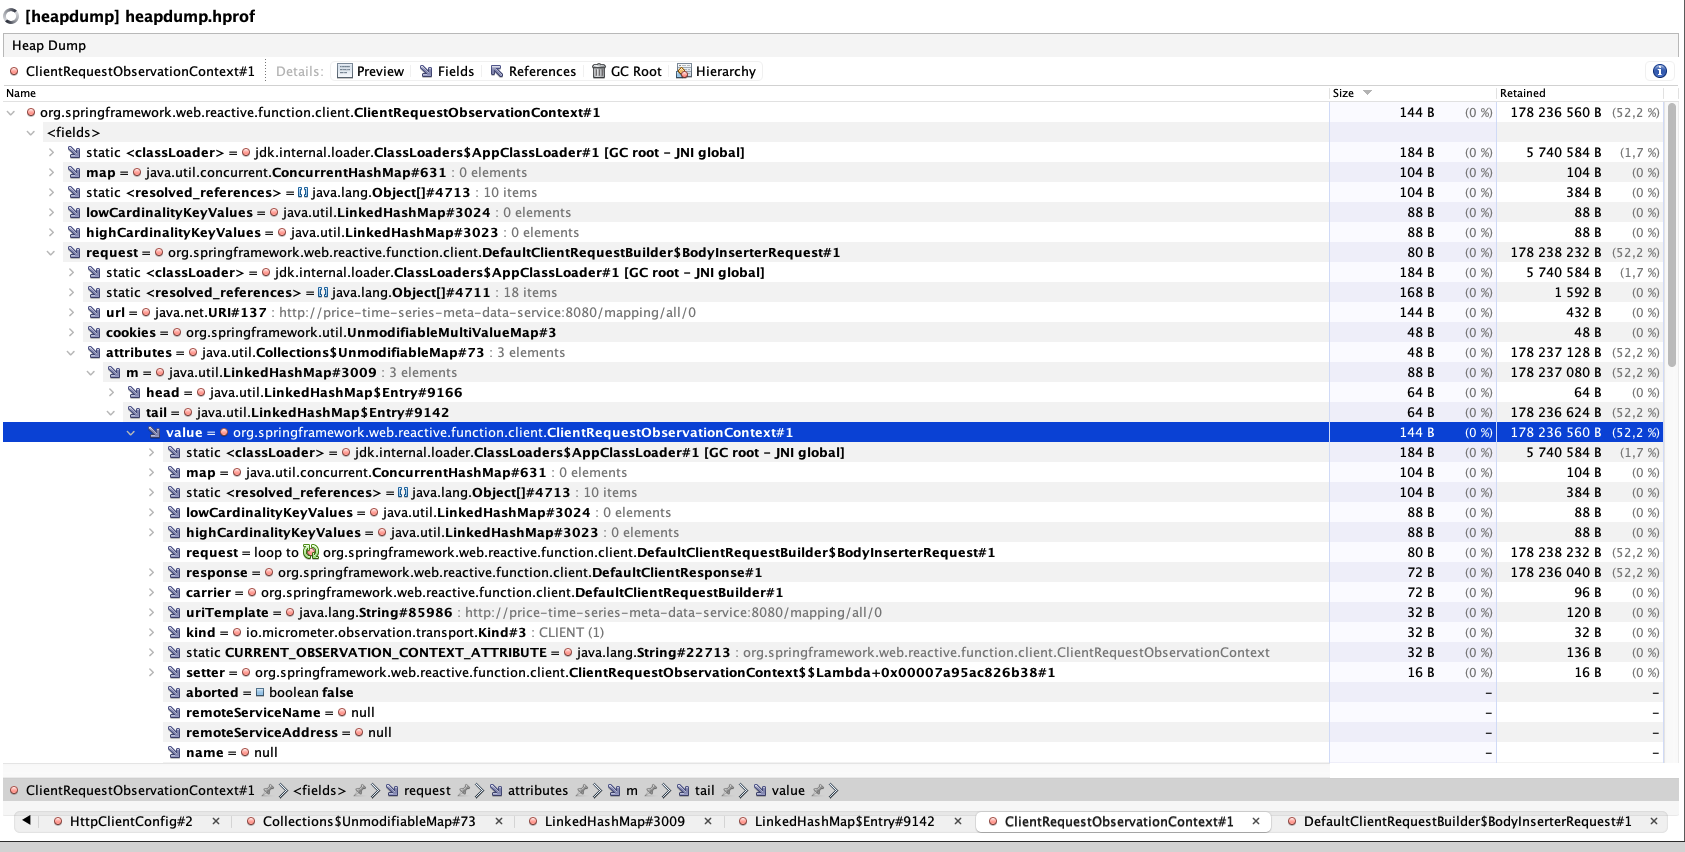
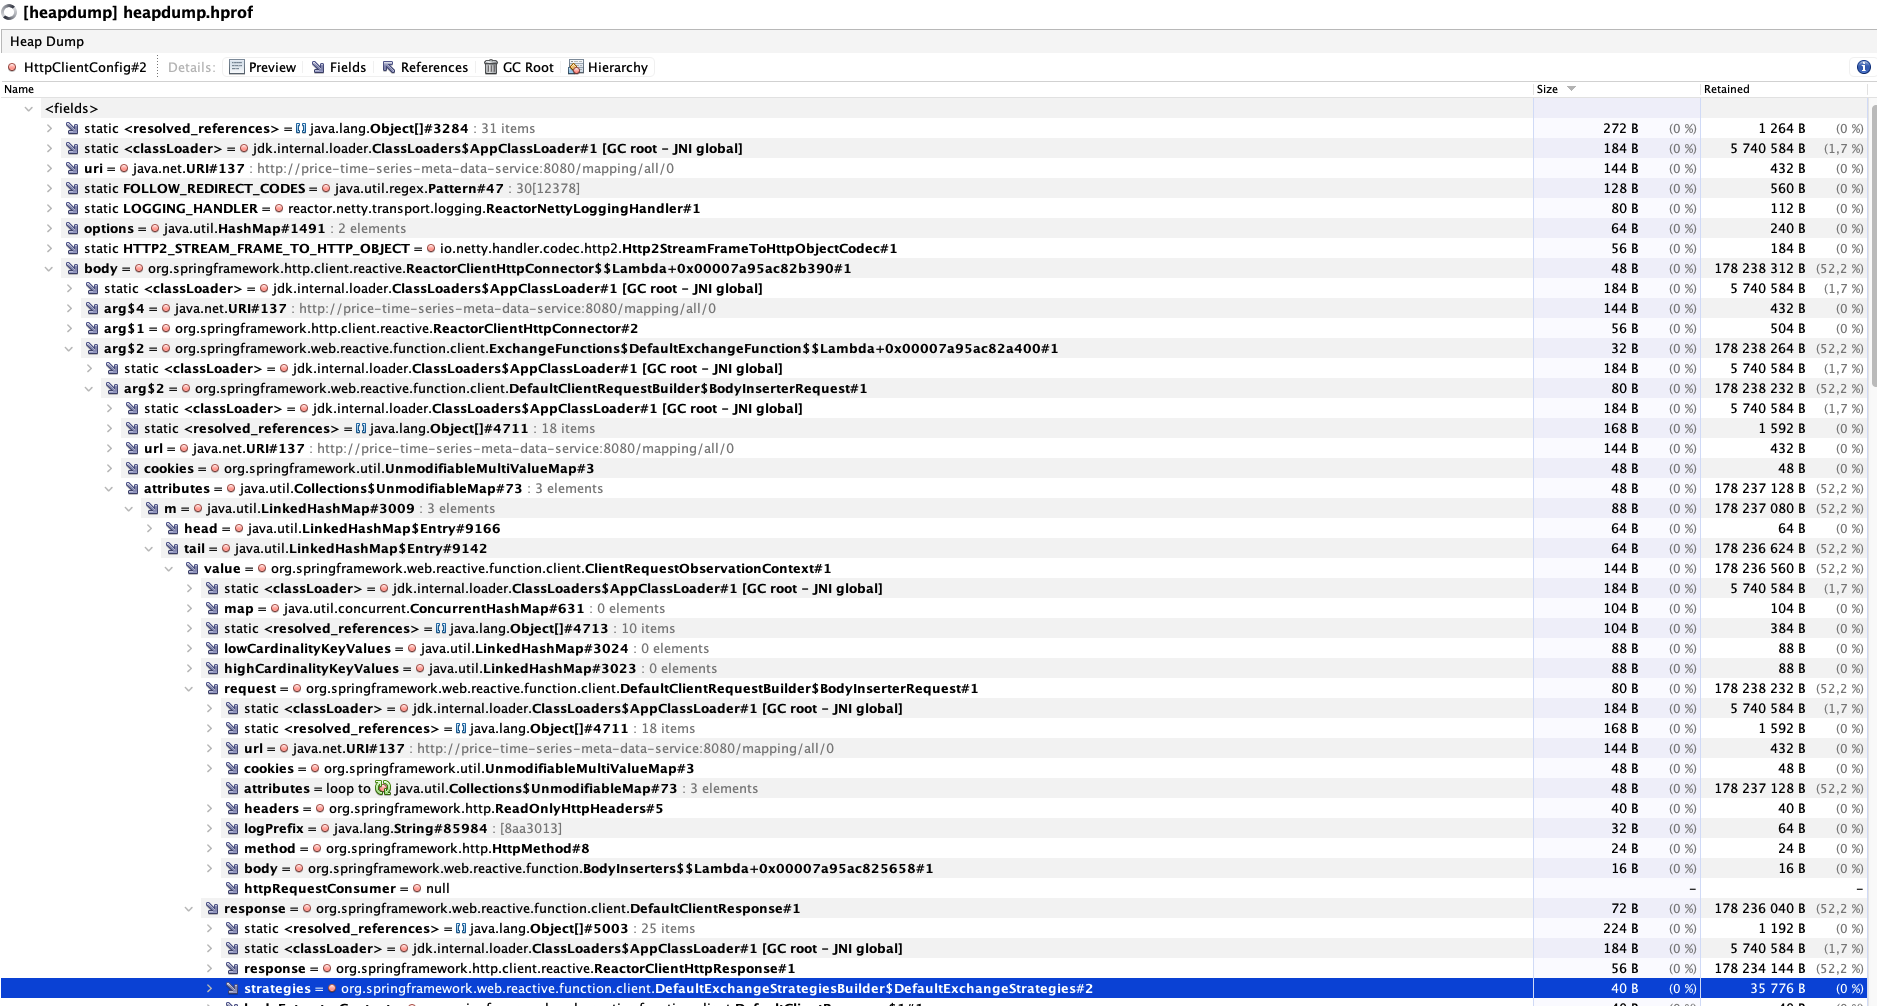
Have done an heap dump multiple times and retained memory increasing for the specified types. Attaching a print screen of the heap dump:
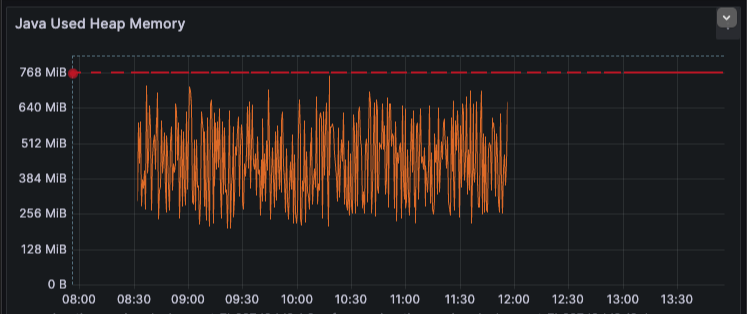
Heap before update
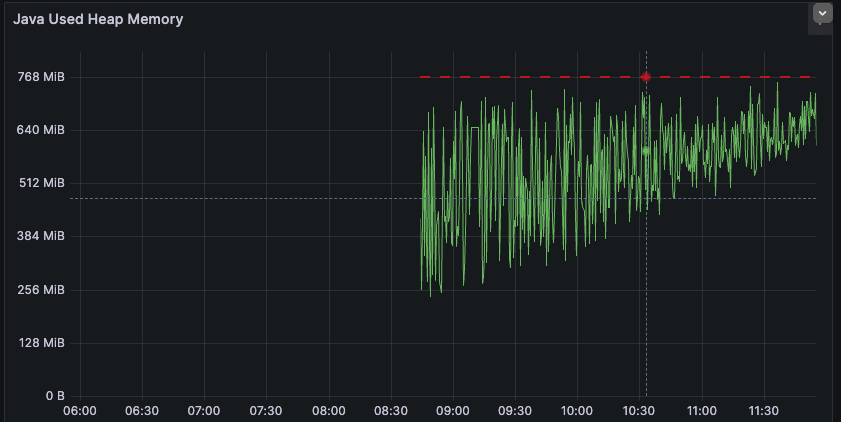
Heap after update
Comment From: bclozel
Thanks for the report.
Unfortunately, I can't reproduce this issue locally. I'm using Spring Boot 3.2.2 and I've locked the Spring Framework version to ext['spring-framework.version'] = "6.1.2".
I'm using the following controller to run many requests with the WebClient:
package com.example.webclientleak;

import reactor.core.publisher.Flux;
import reactor.core.publisher.Mono;

import org.springframework.web.bind.annotation.GetMapping;
import org.springframework.web.bind.annotation.RequestParam;
import org.springframework.web.bind.annotation.RestController;
import org.springframework.web.reactive.function.client.WebClient;

@RestController
public class TestController {

    private final WebClient webClient;

    public TestController(WebClient.Builder builder) {
        this.webClient = builder.baseUrl("http://localhost:8080").build();
    }

    @GetMapping("/test")
    public String test() {
        return "TEST";
    }

    @GetMapping("/")
    public Mono<String> index(@RequestParam int count) {
        return Flux.range(1, count)
                .flatMap(i -> this.webClient.get().uri("/test").retrieve().bodyToMono(String.class))
                .last();
    }
}
I ran many of queries against the main endpoint (so millions of webclient requests) and I don't see any memory leak in my tools. The Java heap is not growing and I can consistently get it down when triggering manual GCs.
I don't understand why #31702 would change anything, as this commit doesn't change the nature of this "cycle" since the observation context was already pointing to the request builder and the request (which itself contains the context as an attribute). This change merely changes the ordering of things. I don't think cycle like this cause memory leaks in the first place, as they're not reachably from GC roots once the request is sent. Do you have a different perspective on this?
It would be interesting to get why those context instances are still reachable in your case and what's holding a reference to them. In my case, I only had a couple of those in memory as they were held by the observation registry, waiting to be sent/processed.
Additionnally, any indication on how to reproduce this locally would be very much welcome.
Thanks!
Comment From: erimolNordnet
Not really sure either, but as the heapdump indicates some memory are retained and the change happened to the classes what I can see. That was my only lead: From 6.1.2:
ClientRequestObservationContext observationContext = new ClientRequestObservationContext(requestBuilder);
and before in 6.1.1 it was created without the request:
ClientRequestObservationContext observationContext = new ClientRequestObservationContext();
Also this in 6.1.2
    ClientRequest request = requestBuilder
                        .attribute(ClientRequestObservationContext.CURRENT_OBSERVATION_CONTEXT_ATTRIBUTE, observationContext)
                        .build();
At least it feels related from the bump in version and what I can see from the dump.
WIll give it a try locally in my integration test if I can hammer on one endpoint, haven't been able to reproduce locally so far either
Comment From: erimolNordnet
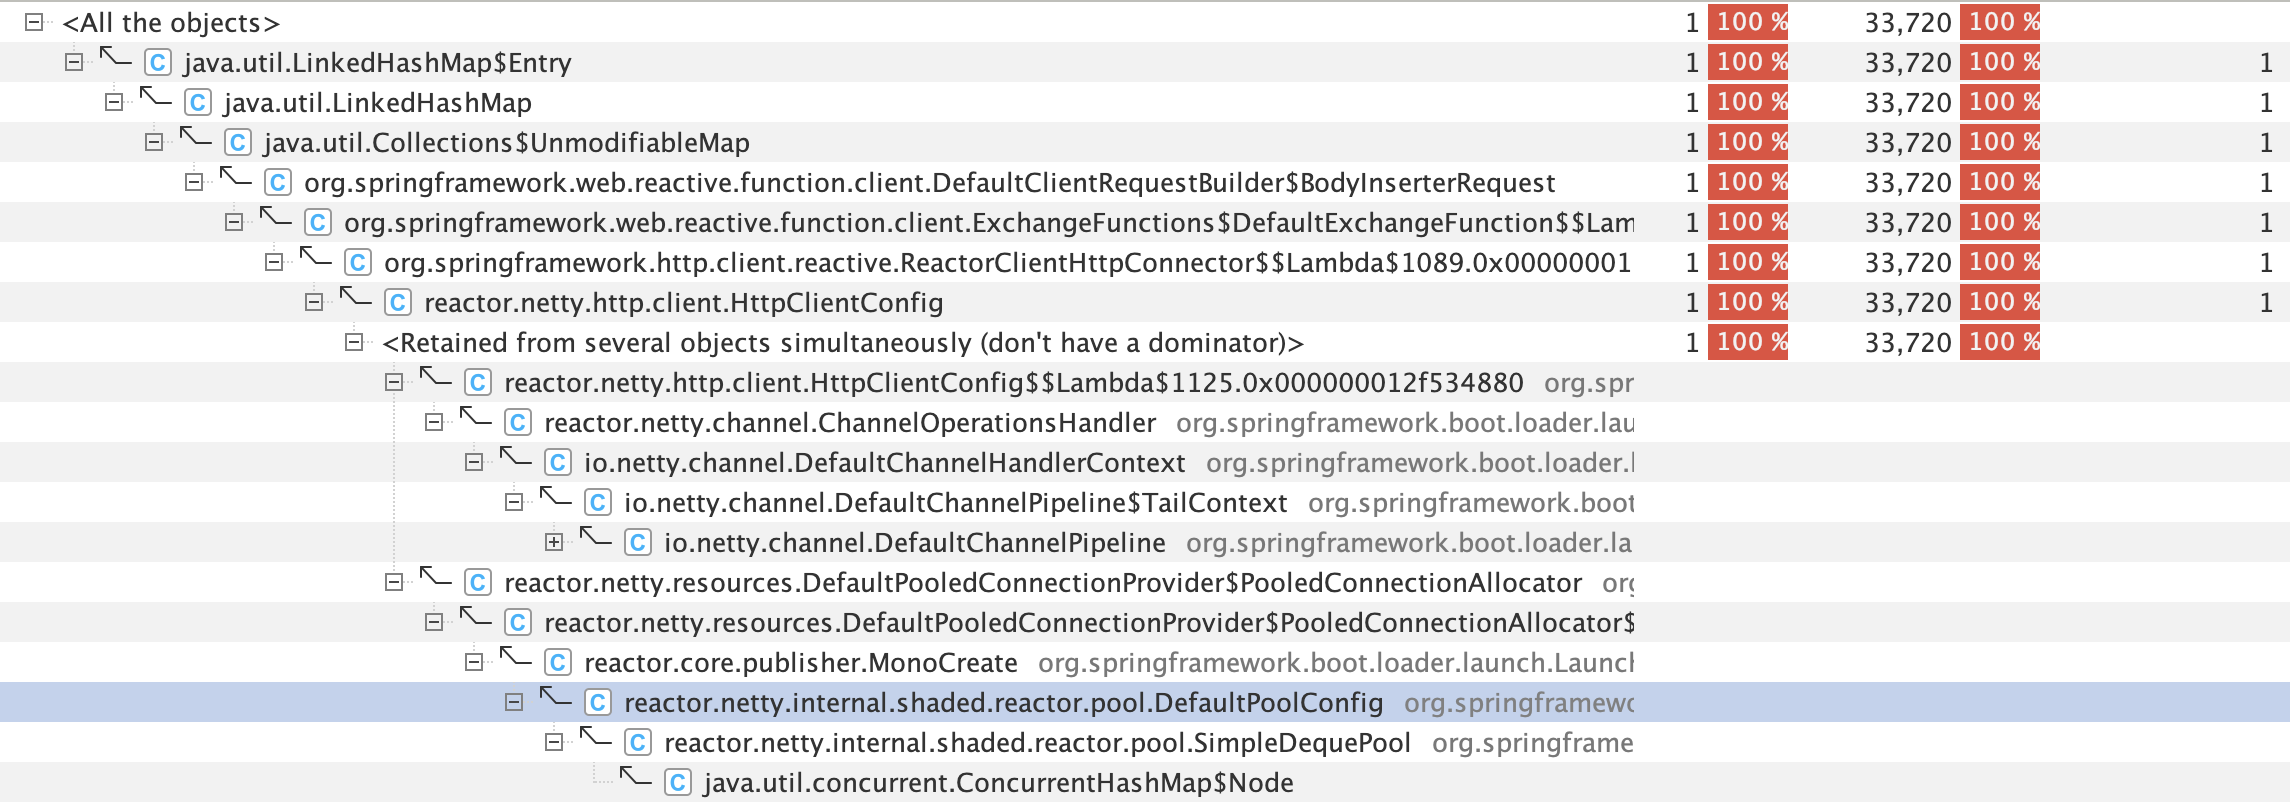
Will give you the trace from heapdump as well:
Comment From: bclozel
Did the reactor-netty dependency version change at all between both? Can you replicate that on a smaller sample?
Comment From: erimolNordnet
Only change was webflux, I done a lot of tests to be able to isolate which change caused the issue:
I explicit added this dependency and the only change was from
<dependency>
            <groupId>org.springframework</groupId>
            <artifactId>spring-webflux</artifactId>
            <version>6.1.2</version>
        </dependency>
Comment From: erimolNordnet
Can you replicate that on a smaller sample?
How do you mean like a test app? Or the amount of traffic?
Comment From: bclozel
I created a small project on start.spring.io and added the controller I shared in a comment above. This doesn't reproduce the memory leak after millions of requests. I'm thinking that I'm probably missing some part of the setup. Maybe a specific Reactor version is required, a specific configuration property? Or maybe the server part needs to be using MVC, not WebFlux as I was using in my sample? Maybe this only happens on a particular JVM version? Maybe an actual observation registry implementation needs to be involved?
I'm not saying this is not a bug on our side, but it's hard to fix a memory leak without reproducing it and seeing where the allocation happens. If you can reproduce the issue on a smaller sample, I'd be happy to have a look and work on a fix. Without that, my best bet would be to revert the change I introduced in 6.1.2 but this would give zero guarantee (you could try it for yourself in your application by using spring-webflux 6.1.2 and adding the former ClientRequestObservationContext implementation in your application to override the changes).
Comment From: erimolNordnet
Totally understand, I had the ambition to recreate it locally as well without success, creating a smaller sample is therefore not as easy, have only seen this in live traffic after 2-3h running.
Also using Webflux in the server app. Could try your suggestion to include the former impl, but even if that is successful It's not the best approach going forward...
Comment From: bclozel
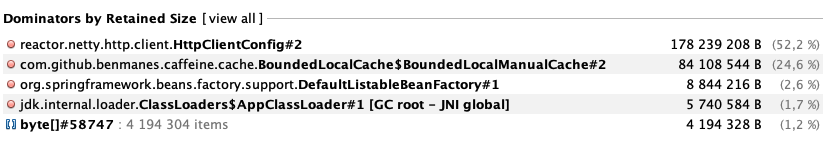
You previous screenshot points to HttpClientConfig and org.springframework.http.client.reactive.ReactorClientHttpConnector#connect being GC roots and keeping references to requests around (unless this screenshot is not about GC roots?).
Also using Webflux in the server app. Could try your suggestion to include the former impl, but even if that is successful It's not the best approach going forward...
I'm not suggesting that as a solution, but really another step to ensure that this change is the culprit, even though we can't reproduce it locally. To be honest, I'm not sure how the change in 6.1.2 could create a problem like this as the " reference cycle" existed already.
Comment From: erimolNordnet
I created a small project on start.spring.io and added the controller I shared in a comment above. This doesn't reproduce the memory leak after millions of requests. I'm thinking that I'm probably missing some part of the setup. Maybe a specific Reactor version is required, a specific configuration property?
I have run with lots of different versions of the other dependencies reactor, netty and so on .. but seems like this patch version is the one that triggers the behaviour. I guess It could be some other component that causes the issues, hard to tell
Comment From: erimolNordnet
I'm not suggesting that as a solution, but really another step to ensure that this change is the culprit, even though we can't reproduce it locally. To be honest, I'm not sure how the change in 6.1.2 could create a problem like this as the " reference cycle" existed already.
Yes looking into the code, ClientRequestObservationContext had a reference to ClientRequest
but one new thing is I guess that also ClientRequest gets a reference to ClientRequestObservationContext as well, and therefore gets circular that didin't exist before?: @bclozel (I got tricked by the commit for this fix as there was a reference from request as well in the diff but not in the actual release code)
Comparing against this version: https://github.com/spring-projects/spring-framework/blob/v6.1.1/spring-webflux/src/main/java/org/springframework/web/reactive/function/client/DefaultWebClient.java#L453
Added in 6.1.2
ClientRequest request = requestBuilder
                        .attribute(ClientRequestObservationContext.CURRENT_OBSERVATION_CONTEXT_ATTRIBUTE, observationContext)
                        .build();
Comment From: bclozel
This was added in #31609, not in #31702. There was already a cycle in the sense that:
- in 6.1.1 we had Publisher -> reactor context -> observation context -> request -> Publisher
- in 6.1.2 we also have Publisher -> request -> observation context -> request
Let's take a step back. As far as I know, all JVM garbage collectors know how to collect cyclic references between objects as long as there is no reference traced back to one of the GC roots. If you can share a reference about a GC implementation that doesn't, I'd be happy to undo the change in #31609.
Comment From: erimolNordnet
Not trying to have blame game here just dropping ideas what actually changed, aslo don't think your comment is reasonable as not anyone of us reading GC specs for fun:
Both https://github.com/spring-projects/spring-framework/issues/31609 and https://github.com/spring-projects/spring-framework/issues/31702 went out in 6.1.2 and I comparing code against 6.1.1 which are the latest one that worked with my app. And yes there were probably a cycle already, but not between request -> observation context.
The problem is probably somewhere else where the references are hold, as there are new dependencies created that didn't exists before could potentially change behaviour.
And the heap dump I have produced points in that direction, however I don't have the knowledge and inner workings of Spring Webflux to be able to hunt down the error.
So I guess this one is on hold/closed if I cannot produce a small sample to reproduce this locally?
Comment From: bclozel
Not trying to have blame game here just dropping ideas what actually changed, aslo don't think your comment is reasonable as not anyone of us reading GC specs for fun:
I don't mean to ask unreasonable things, I'm far from being a GC expert myself. I'm also dropping ideas to understand why you're seeing this issue.
Both https://github.com/spring-projects/spring-framework/issues/31609 and https://github.com/spring-projects/spring-framework/issues/31702 went out in 6.1.2 and I comparing code against 6.1.1 which are the latest one that worked with my app. And yes there were probably a cycle already, but not between request -> observation context.
I'm not denying the fact that 6.1.2 has an issue and 6.1.1 has not. I've suggested several ways to isolate changes even more (running with a patched version of the observation context).
And the heap dump I have produced points in that direction, however I don't have the knowledge and inner workings of Spring Webflux to be able to hunt down the error.
The dump shows that objects are indeed present in memory, but it's not clear what's keeping a reference to those. If I'm reading those correctly, the connector is keeping those alive? I've tried to reproduce this locally but couldn't.
Given the current state of this issue, the only thing I can do is to revert one of the two changes we discussed (or both), and tell community members that we've undone those fixes and enhancements because we think there could be a memory leak but couldn't find it. There are a lot of services using WebClient out there, and "obvious" memory leaks would be reported quite quickly. I'm thinking that there might be a combination of things here and we need to find out about those to fix the issue.
Anything you can provide would help us figure out the problem: typically, a way to reproduce this would be perfect.
Comment From: erimolNordnet
I get your point! And yes, probably the combination of components is the culprit, and maybe also the specific characteristic of our app and traffic.
However I think I have done what I can do by isolation of the lib and only bumping this specific version from 6.1.1 to 6.1.2, think that serves same purpose as patching files, also don't know any good way of doing that :)
I think the best way forward would be to recreate it locally from my side, maybe I will give it shot again later on, can create another issue in that case if you want to close this one.
Thanks for your help so far!
Comment From: bclozel
Just an additional thought.
Us adding the observation context as a request attribute means that we're tying more memory directly to the request and that an existing leak could be more visible and cause problems (whereas before it wouldn't be noticed.
After another run (with millions of requests) I captured a single lingering instance that was tied to the Reactor connection pool. So probably a connection being kept alive for later reuse - no, technically not a leak. Maybe you're seeing the same, but with many connections to different hosts?
I'll leave this issue opened for now, I'm trying various things on my side unsuccessfully so far (for example, re-creating a WebClient instance from the builder for every request). If you're configuring the Reactor Netty client connector in any way, or using any kind of additional layer (like Spring Cloud), it would be useful to know in order to guide our steps towards a repro case.
Comment From: erimolNordnet
Interesting!
The highest level in the hierarchy that I can see is reactor.netty.http.client.HttpConfig -> ReactorClientHttpConnector:lambda -> DefaultExchangeFunction:lambda -> then comes the Request > ObserverContext and so on ...
In our case it will be millions of requests as well, and also our main app this one can have multiple calls downstream to other microservices. We therefore have multiple WebClient:s for different service calls:
This is how we typically creates the client:
  HttpClient httpClient = HttpClient.create()
                .option(ChannelOption.CONNECT_TIMEOUT_MILLIS, restProperties.getTimeout())
                .responseTimeout(Duration.ofMillis(restProperties.getTimeout()));

        log.info("Http warmup");
        httpClient.warmup().block();
        log.info("Http warmup done");

        this.webClient = WebClient.builder()
                .clientConnector(new ReactorClientHttpConnector(httpClient))
                .defaultHeader(HttpHeaders.CONTENT_TYPE, MediaType.APPLICATION_JSON_VALUE)
                .baseUrl(restProperties.getHost())
                .exchangeStrategies(ExchangeStrategies.builder()
                        .codecs(configurer -> configurer
                                .defaultCodecs()
                                .maxInMemorySize(-1)) //Unlimited response sizes
                        .build())
                .build();
Comment From: erimolNordnet
Some update:
We have managed to avoid the memory leak by instead of using ReactorClientHttpConnector go with JettyClientHttpConnector, so to summarise it feels lika a combination of 3 different things:
- Upgrading from version 6.1.1 -> 6.1.2
- Using default ReactorClientHttpConnector
- Our application flow (one thing that stod out was that we had quite a lot of cancellation on outgoing http calls, this component serves kind of a bff and doing multiple parallell requests), we got a lot of errors in our log once we shifted to Jetty connector. (Will try to look into that as well later on and to recreate)
Comment From: arana3
@erimolNordnet -
In the snippet you shared here, it does not seem like you are using Spring Boot's managed WebClient builder. Per reference documentation, the OOTB managed builder has Observation component pre-attached:
https://docs.spring.io/spring-framework/reference/integration/observability.html#observability.http-client.webclient
Its a long shot, but I wonder if you use OOTB Spring managed builder if the issue is re-producible. Of course, the other challenge is that there is no reproducer app (yet).
Comment From: bclozel
I think this currently points to a "connection leak", or at least a setup where many connections are cancelled or closed and the connection pool is taking some time to invalidate and clean up resources. The change in Spring Framework is likely to make this behavior more obvious by attaching more memory to the connection attribute?
I'll close this issue for now since I still haven't found a way to reproduce this. We'll reopen as soon as we have a reproduced so we can investigate.
Comment From: konner91
Hi together,
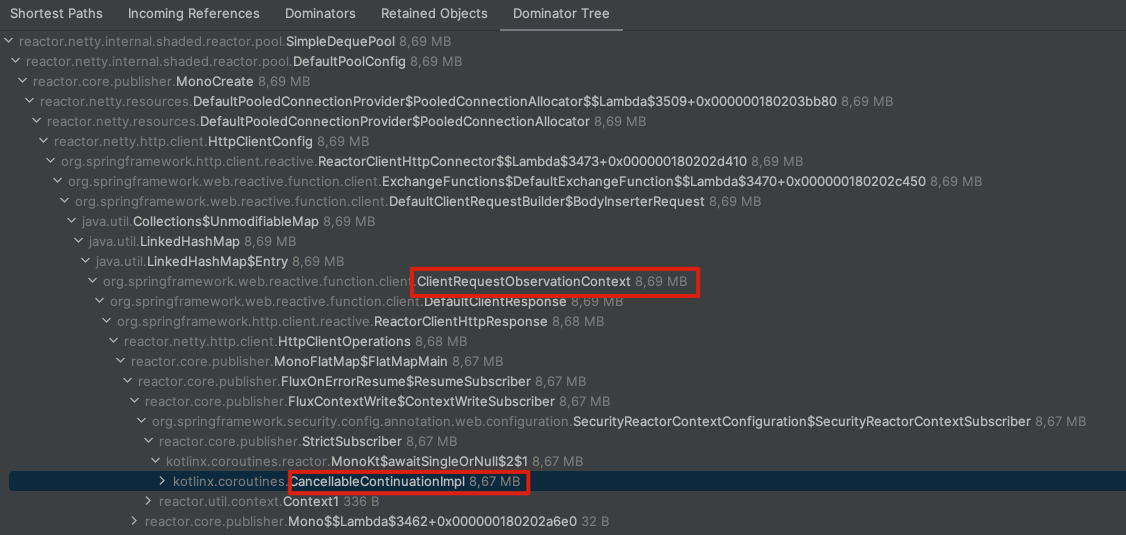
I upgraded our application from Spring Boot 3.0.13 to 3.2.2 and I see the same issue as @erimolNordnet reported, too. The issue appears at the moment only in our background job where we make a lot of http requests and the cpu usage is very high. Before we make a request we load some data which could be multiple megabytes. In the screenshot the CancelableContinuationImpl contains the data which was loaded before. It looks like that the netty client underneath is not releasing the memory after the request. Our webclient config uses a connection pool with the lifo setting and the evictInBackground setting is set to 45 seconds. In our api instance we couldn`t see this issue. Maybe this helps to get an idea why this is happening. Our quickfix is to set spring-webflux to 6.1.1.
Best,
Konstantin
Comment From: bclozel
Can you provide a minimal sample application that demonstrates the problem?
You seem to imply that the connection pool does not release the connection but this is not managed by Spring so I don't see the link. I think that the leak might already be there and that reverting the Spring version might just make the problem less visible.
I'll revisit this anyway to check whether we can improve things. But just so you know we have not found any proof of leak in Spring Framework so far.
Comment From: konner91
Unfortunately I was not able to reproduce it locally. But I keep trying. Do you know if there is a place where the request attributes are cleared before the connection is released to the pool?
Comment From: bclozel
The request attributed were never cleared as the request object instance is getting GC'd.
Since this bothers people that much we might remove the observation as a request attribute and just let people get it from the observation context. This probably won't solve the actual memory management issues but this might make it less visible.