Affects: >=5.3.3
Consider a Spring Boot application with the following websocket configuration class:
@Configuration
@EnableWebSocketMessageBroker
public class WebSocketConfig implements WebSocketMessageBrokerConfigurer {

    @Override
    public void configureMessageBroker(MessageBrokerRegistry config) {
        config.setApplicationDestinationPrefixes("/app");
        config.enableSimpleBroker("/topic", "/queue");
        config.setUserDestinationPrefix("/user");
    }

    @Override
    public void registerStompEndpoints(StompEndpointRegistry registry) {
        String[] cors= new String[] { "*" };
        registry.addEndpoint("/server").setAllowedOriginPatterns(cors).withSockJS();
    }

}
This configuration creates a STOMP endpoint /server over SockJS.
During startup, we observe a short time window, in which clients are able to connect to that endpoint (CONNECT message), without receiving a CONNECTED response from the server.
Precisely, the behavior is as follows:
- The
/infoREST endpoint (SockJS protocol) is available and responds correctly. - The websocket over
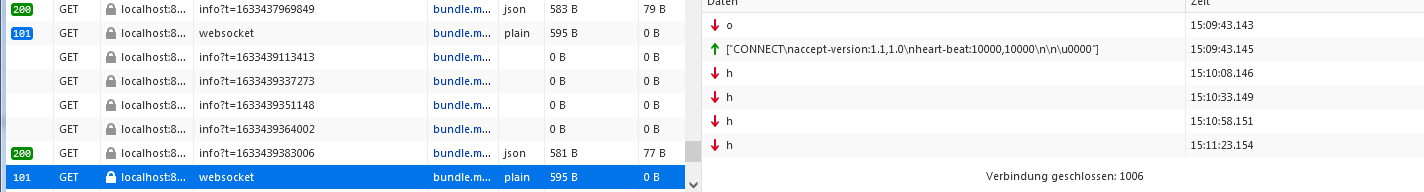
ws://.../server/.../websocketis available. - The initial message
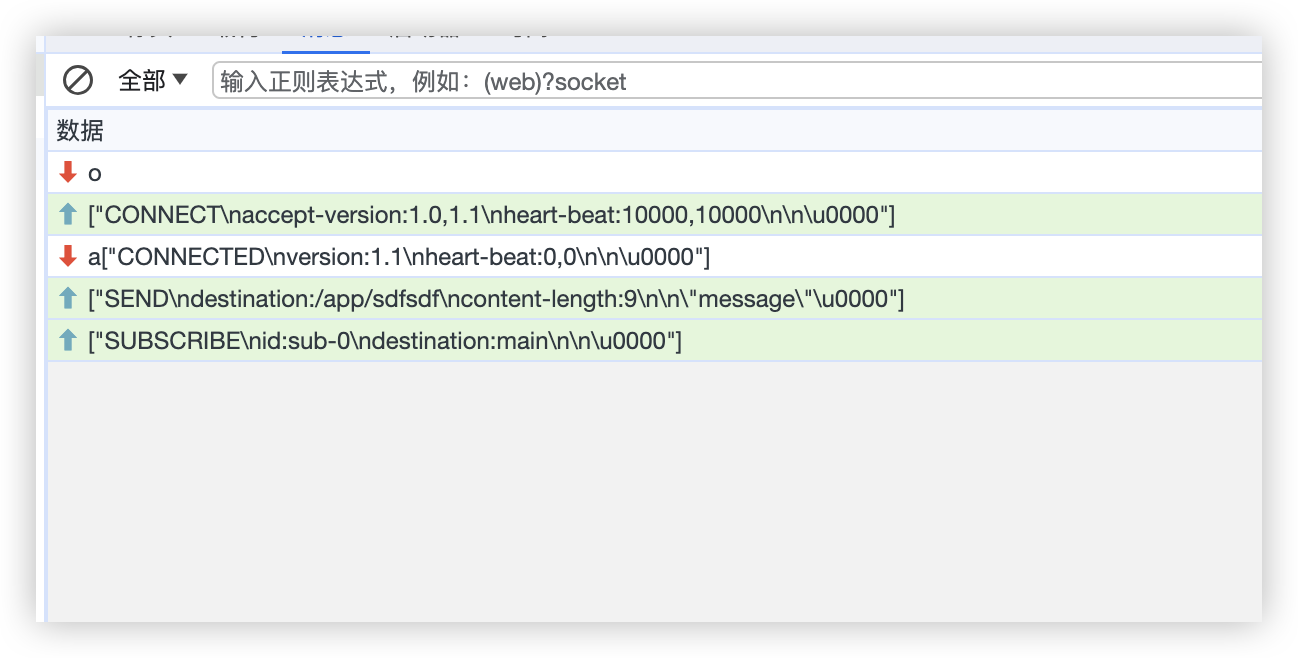
ois sent from the server just after the websocket connection is established. - The client sends the message
["CONNECT\naccept-version:1.1,1.0\nheart-beat:10000,10000\n\n\u0000"]. - The server does not respond to that message, however, it sends periodical heartbeat messages
h. - The client (JS frontend library) resides in a not-connected state without trying to reconnect.
Screenshot:
Relevant log output during startup:
2021-10-05 15:13:13.796  INFO 21428 --- [           main] o.s.b.w.e.t.TomcatWebServer              : Tomcat started on port(s): 8080 (http) with context path ''
[...]
2021-10-05 15:14:09.160  INFO 21428 --- [MessageBroker-4] o.s.w.s.c.WebSocketMessageBrokerStats    : WebSocketSession[3 current WS(3)-HttpStream(0)-HttpPoll(0), 3 total, 0 closed abnormally (0 connect failure, 0 send limit, 0 transport error)], stompSubProtocol[processed CONNECT(3)-CONNECTED(0)-DISCONNECT(0)], stompBrokerRelay[null], inboundChannel[pool size = 0, active threads = 0, queued tasks = 0, completed tasks = 0], outboundChannel[pool size = 0, active threads = 0, queued tasks = 0, completed tasks = 0], sockJsScheduler[pool size = 8, active threads = 1, queued tasks = 4, completed tasks = 5]
[...]
2021-10-05 15:14:11.355 DEBUG 21428 --- [pool-4-thread-1] o.s.m.s.b.SimpleBrokerMessageHandler     : Starting...
2021-10-05 15:14:17.349  INFO 21428 --- [           main] o.s.m.s.b.SimpleBrokerMessageHandler     : BrokerAvailabilityEvent[available=true, SimpleBrokerMessageHandler [org.springframework.messaging.simp.broker.DefaultSubscriptionRegistry@134a27c1]]
2021-10-05 15:14:17.350  INFO 21428 --- [           main] o.s.m.s.b.SimpleBrokerMessageHandler     : Started.
The log output of WebSocketMessageBrokerStats shows three connections already before the SimpleBrokerMessageHandler is starting, respectively SubProtocolWebSocketHandler#start() has been called.
After SubProtocolWebSocketHandler#start() has been called, the server responds correctly.
Comment From: Polve
Does the problem occur without sockjs?
Comment From: snicoll
Can you please move that code in text in a small sample that we can run ourselves. I want to make sure that we're not missing anything. Also, answering the question above would be nice to help us track down where that would come from.
Comment From: spring-projects-issues
If you would like us to look at this issue, please provide the requested information. If the information is not provided within the next 7 days this issue will be closed.
Comment From: zxuanhong
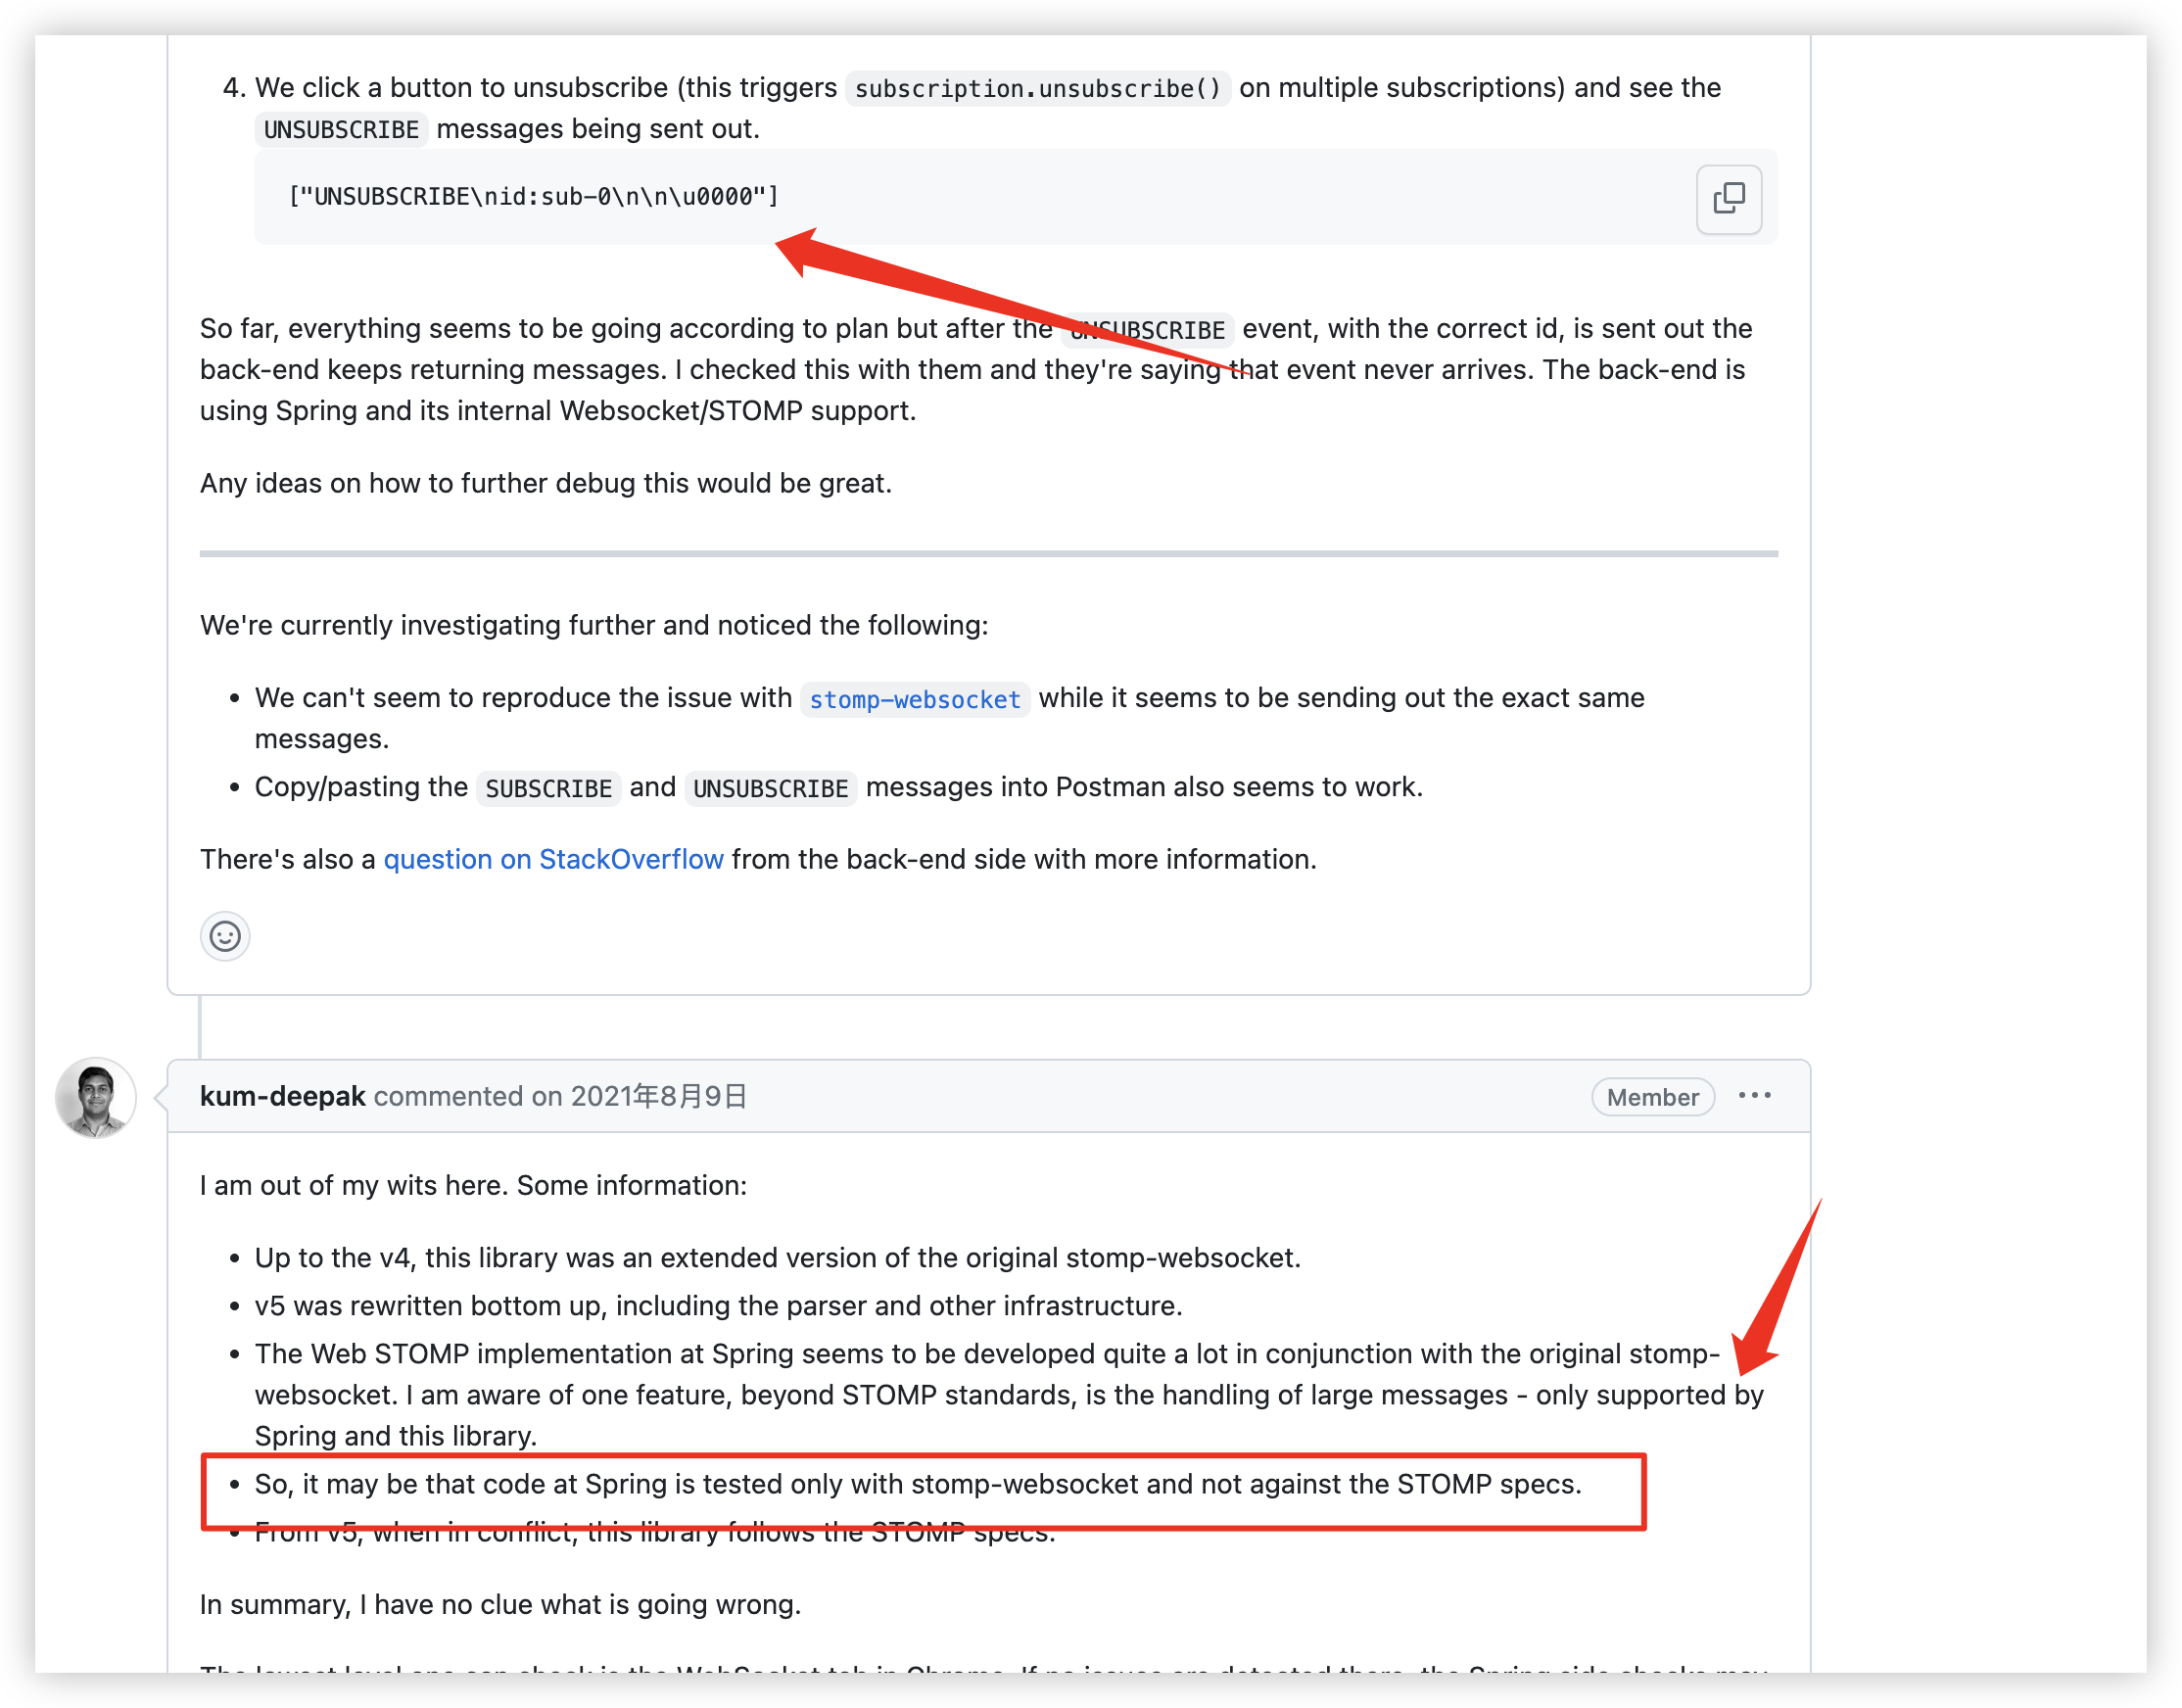
@snicoll @trylimits You can take a look at this https://github.com/stomp-js/stompjs/issues/370
- heartbeat info(ok)
Comment From: zxuanhong
@snicoll @trylimits After testing, spring boot is fine.Only the web connection needs to be wrapped in SockJS 1. npm install sockjs-client @stomp/stompjs 3. connect
import { Client, Versions } from '@stomp/stompjs'
import type { StompConfig } from '@stomp/stompjs'
import SockJS from 'sockjs-client/dist/sockjs.min.js'
const stompConfig: StompConfig = {
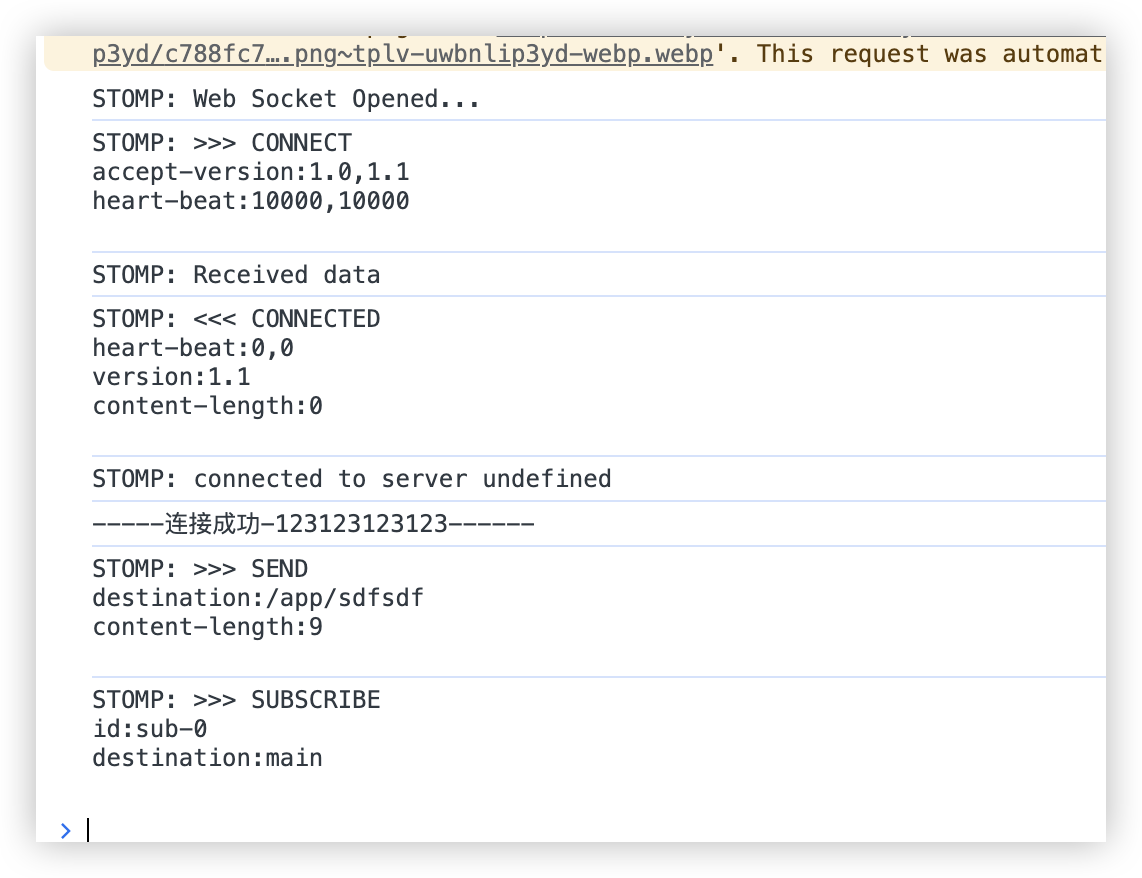
debug: function (str) {
console.log('STOMP: ' + str)
},
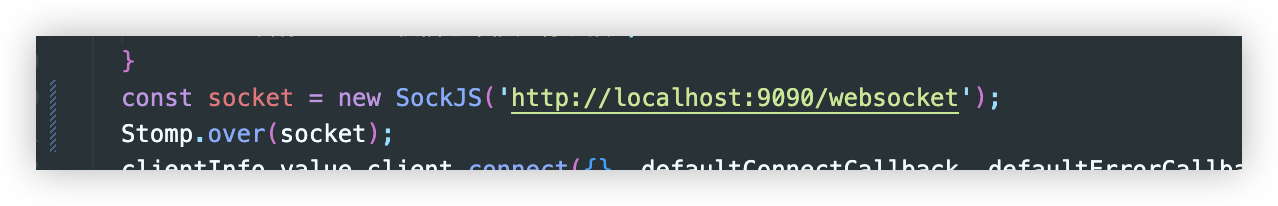
webSocketFactory: () => {
return new SockJS('http://localhost:9080/websocket')
},
reconnectDelay: 20000,
stompVersions: new Versions([Versions.V1_0, Versions.V1_1]),
onConnect: handleOnConnect
}
const client = new Client(stompConfig)
client.activate()
- 'brokerURL' cannot be used. This is the broker address
Comment From: trylimits
I replicated the issue by using the Spring WebSocket example.
I used Spring Initializr with the following settings:
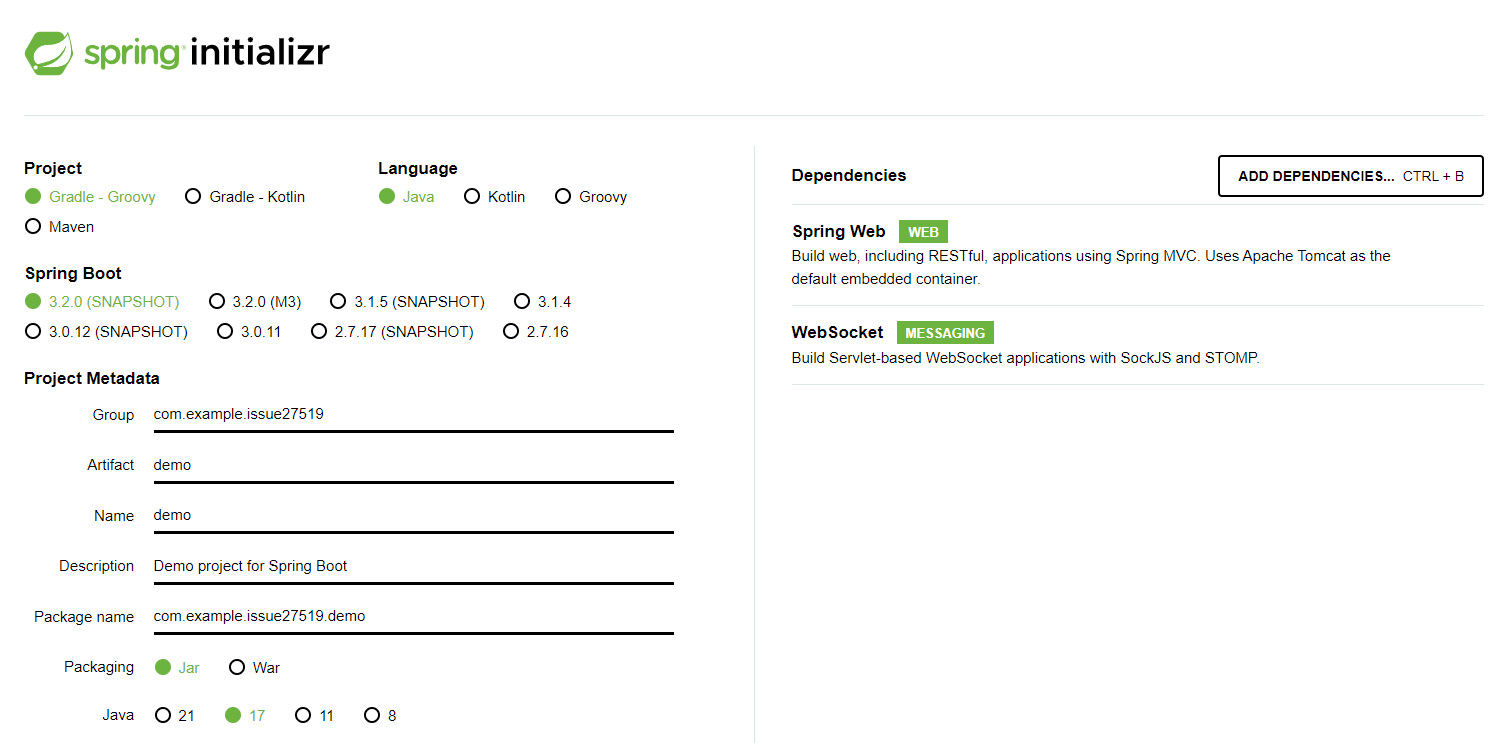
This example does not use SockJS and the behavior is still reproducible.
Steps to reproduce:
1. Start the Spring service
2. Visit http://localhost:8080 (Chrome, latest version)
3. Click "Connect" (connection will be successful)
4. Stop the Spring service
5. Set a breakpoint at line SimpleBrokerMessageHandler:268 (method startInternal, line if (this.taskScheduler != null) {)
6. Start the service in debug mode
7. The breakpoint triggers
8. Wait for 15s (the frontend application will try to reconnect automatically in the background)
9. Resume the program execution
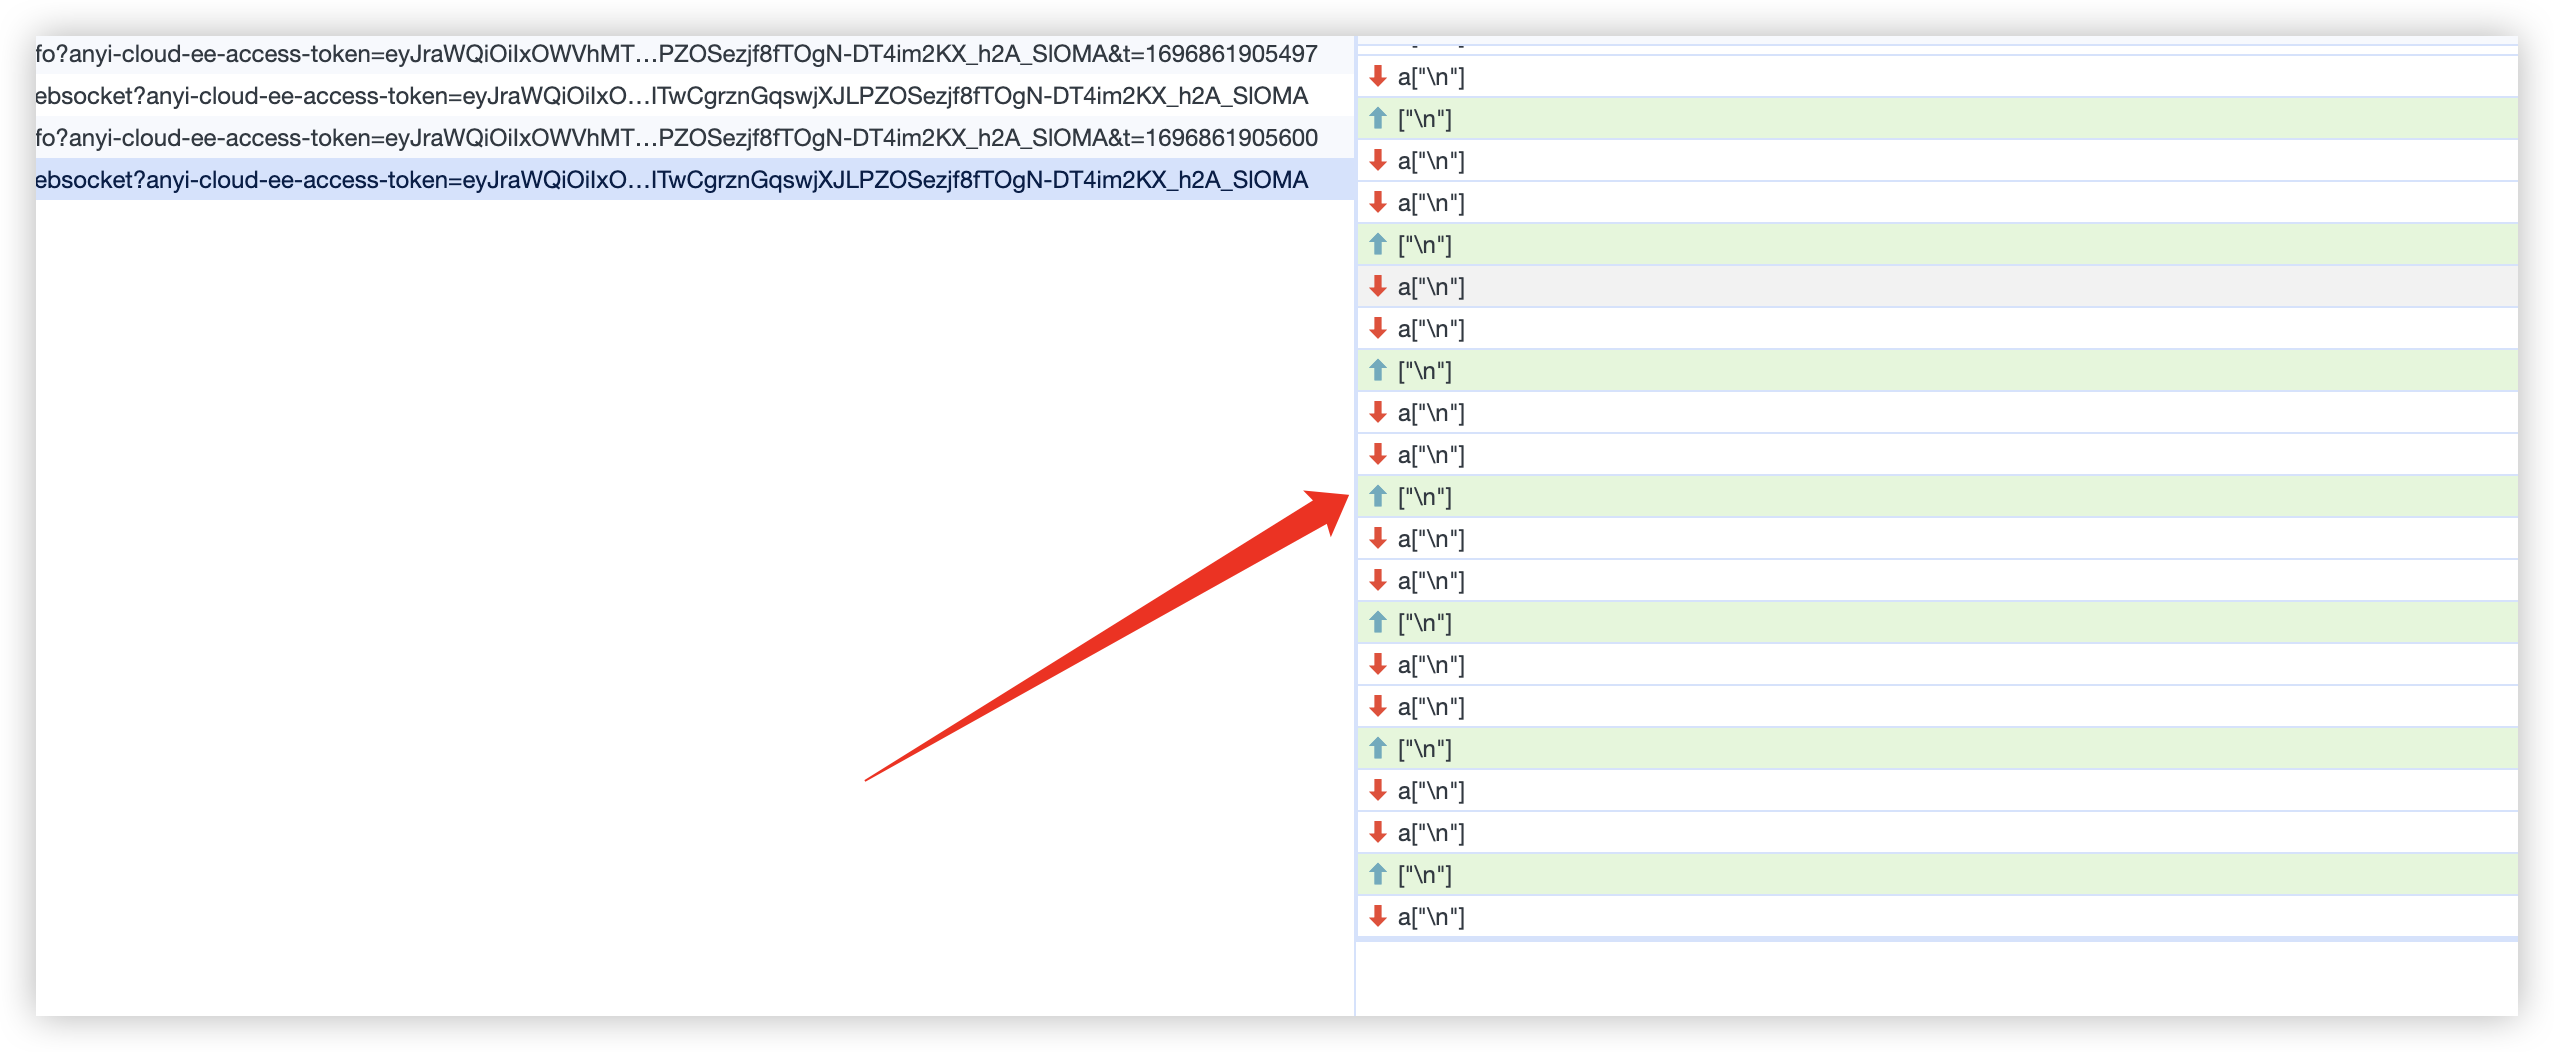
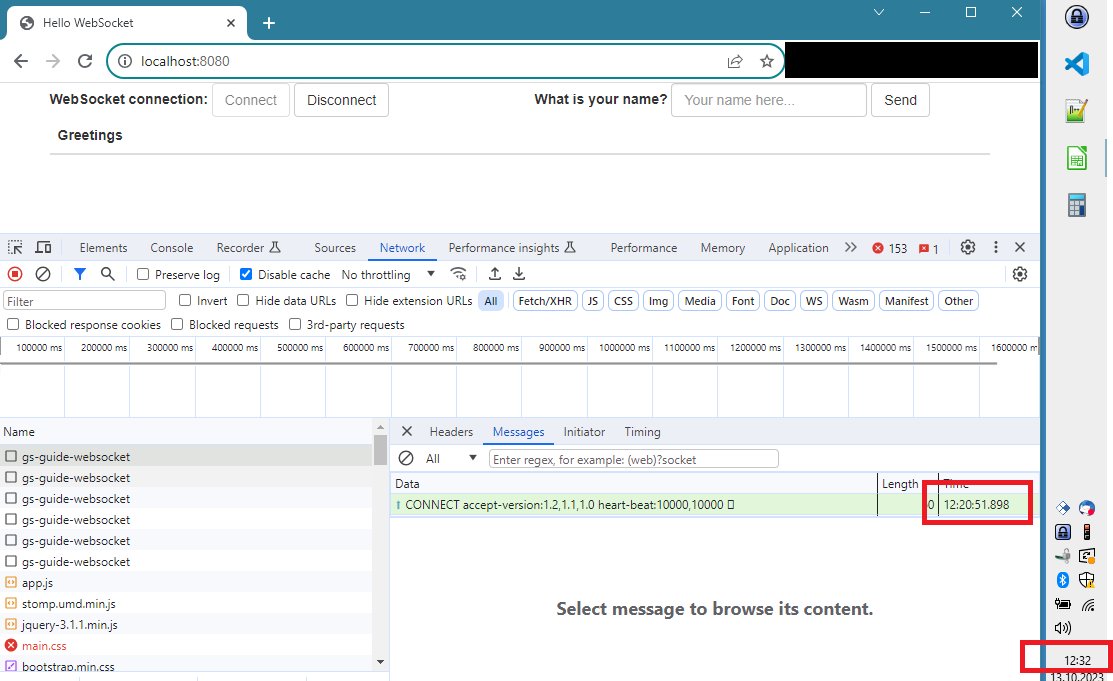
10. The frontend application has established a (pending) WebSocket connection. The stomp client has sent the CONNECT message. The server did not respond with the CONNECTED message, however, the socket stays open forever. The server never responds. Therefore, the client resides in a not-connected state without trying to reconnect.
Screenshot of Chrome Dev Tools showing that the server did not respond:
This behavior is relevant in the following real-world scenario: 1. Thousands of users are connected. 2. We update the backend service and restart it. 3. Some users won't get reconnected automatically. The only solution for them is to refresh the page manually.
We can reproduce that real-world example by simulating 10k clients and restart the backend service. About 10% of the clients face that issue.
Comment From: jhoeller
So this looks like a race condition between the time when the server starts accepting connections and the time when it is actually able to properly respond to those connections (SubProtocolWebSocketHandler.start())? We'll have to revisit our startup arrangement there, either not accepting connections before we are able to respond to them, or tracking early connection registrations and late-responding to them whenever we are able to.
Comment From: jhoeller
Reviewing this with @rstoyanchev, this turns out to be a lifecycle misalignment where the startup of the message broker happens after the startup of the embedded server in Spring boot, leaving some room for mishandling early connections inbetween.
We intend to make the lifecycle phase configurable in SimpleBrokerMessageHandler in 6.1.4 for a start, and then align the default phase with Spring Boot in our Spring Framework 6.2.
Comment From: rstoyanchev
Indeed, SubProtocolWebSocketHandler and SimpleBrokerMessageHandler implement SmartLifecycle to start and stop with the ApplicationContext, and so does Boot's WebServerStartStopLifecycle for the embedded Servlet container. Our components are at the default Integer.MAX_VALUE phase (lowest priority) while Boot's WebServerStartStopLifecycle is at Integer.MAX_VALUE - 2048 by default and that's a higher priority.
That said I see something in the logs that I can't explain:
2021-10-05 15:14:11.355 DEBUG 21428 --- [pool-4-thread-1] o.s.m.s.b.SimpleBrokerMessageHandler     : Starting...
2021-10-05 15:14:17.349  INFO 21428 --- [           main] o.s.m.s.b.SimpleBrokerMessageHandler     : BrokerAvailabilityEvent[available=true, SimpleBrokerMessageHandler [org.springframework.messaging.simp.broker.DefaultSubscriptionRegistry@134a27c1]]
2021-10-05 15:14:17.350  INFO 21428 --- [           main] o.s.m.s.b.SimpleBrokerMessageHandler     : Started.
The "Starting..." log message is on a thread other than main, which is not expected, and it happens almost a full minute after Tomcat has started. Also the log message is DEBUG where in fact we log at INFO. The "Started." message after that is at INFO as expected, but it's back on main somehow, which again seems odd since both log messages are from the same method. Perhaps you've overridden start(), could you clarify?
In any case, as @jhoeller pointed out we intend to make the phase configurable in 6.1.x with #32205, and will also consider changes to the default for 6.2.
Comment From: trylimits
The "Starting..." log message is on a thread other than
main, which is not expected, and it happens almost a full minute after Tomcat has started. Also the log message is DEBUG where in fact we log at INFO. The "Started." message after that is at INFO as expected, but it's back onmainsomehow, which again seems odd since both log messages are from the same method. Perhaps you've overriddenstart(), could you clarify?
The original log output comes from an application running on Spring v5.3.3. This might explain the discrepancy. Since the issue can also be reproduced with the Spring example, perhaps the following log output might be of more interest:
  .   ____          _            __ _ _
 /\\ / ___'_ __ _ _(_)_ __  __ _ \ \ \ \
( ( )\___ | '_ | '_| | '_ \/ _` | \ \ \ \
 \\/  ___)| |_)| | | | | || (_| |  ) ) ) )
  '  |____| .__|_| |_|_| |_\__, | / / / /
 =========|_|==============|___/=/_/_/_/
 :: Spring Boot ::                (v3.1.4)

2024-02-06T13:24:13.487+01:00  INFO 34376 --- [           main] com.example.issue27519.Main              : Starting Main using Java 17.0.5 with PID 34376 (C:\Users\Nico\eclipse-cf-java\spring_framework_issue_27519\bin\main started by Nico in C:\Users\Nico\eclipse-cf-java\spring_framework_issue_27519)
2024-02-06T13:24:13.495+01:00  INFO 34376 --- [           main] com.example.issue27519.Main              : No active profile set, falling back to 1 default profile: "default"
2024-02-06T13:24:14.678+01:00  INFO 34376 --- [           main] o.s.b.w.embedded.tomcat.TomcatWebServer  : Tomcat initialized with port(s): 8080 (http)
2024-02-06T13:24:14.690+01:00  INFO 34376 --- [           main] o.apache.catalina.core.StandardService   : Starting service [Tomcat]
2024-02-06T13:24:14.690+01:00  INFO 34376 --- [           main] o.apache.catalina.core.StandardEngine    : Starting Servlet engine: [Apache Tomcat/10.1.13]
2024-02-06T13:24:14.807+01:00  INFO 34376 --- [           main] o.a.c.c.C.[Tomcat].[localhost].[/]       : Initializing Spring embedded WebApplicationContext
2024-02-06T13:24:14.808+01:00  INFO 34376 --- [           main] w.s.c.ServletWebServerApplicationContext : Root WebApplicationContext: initialization completed in 1252 ms
2024-02-06T13:24:15.307+01:00  INFO 34376 --- [           main] o.s.b.w.embedded.tomcat.TomcatWebServer  : Tomcat started on port(s): 8080 (http) with context path ''
2024-02-06T13:24:15.309+01:00  INFO 34376 --- [           main] o.s.m.s.b.SimpleBrokerMessageHandler     : Starting...
2024-02-06T13:24:15.312+01:00  INFO 34376 --- [           main] o.s.m.s.b.SimpleBrokerMessageHandler     : BrokerAvailabilityEvent[available=true, SimpleBrokerMessageHandler [org.springframework.messaging.simp.broker.DefaultSubscriptionRegistry@43fda8d9]]
2024-02-06T13:24:15.313+01:00  INFO 34376 --- [           main] o.s.m.s.b.SimpleBrokerMessageHandler     : Started.
2024-02-06T13:24:15.324+01:00  INFO 34376 --- [           main] com.example.issue27519.Main              : Started Main in 2.238 seconds (process running for 2.605)
Comment From: rstoyanchev
As I explained already, there is an issue with phase ordering and we plan to address that. However, it's possible that typically doesn't make enough of a difference, and there may be something more going on. Those log messages have been there since 2014, and the first one appearing on a different thread is what caught my eye.
Comment From: okiyama
@zxuanhong Had to comment to thank you for the suggestion to wrap the client in a SockJS connection! I've had an old project that was based on the websocket Spring project here and it's been broken for over a year with dependency drift. All fixed now (mostly) thanks to you though, appreciate it!