Affects: spring-web 6.1.X
Hello,
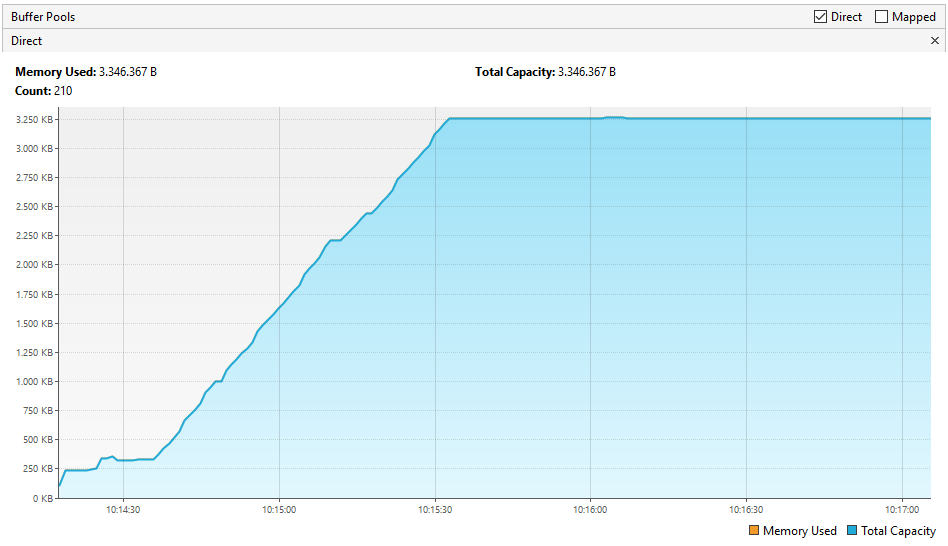
we are experiencing an issue when using StreamingResponseBody with the Undertow application server. There is a leak in the direct buffer pool, which, starting from spring-web version 6.1.X, are no longer being released, eventually leading to an out-of-memory error.
Below is the behavior observed with spring-web version 6.1.X:
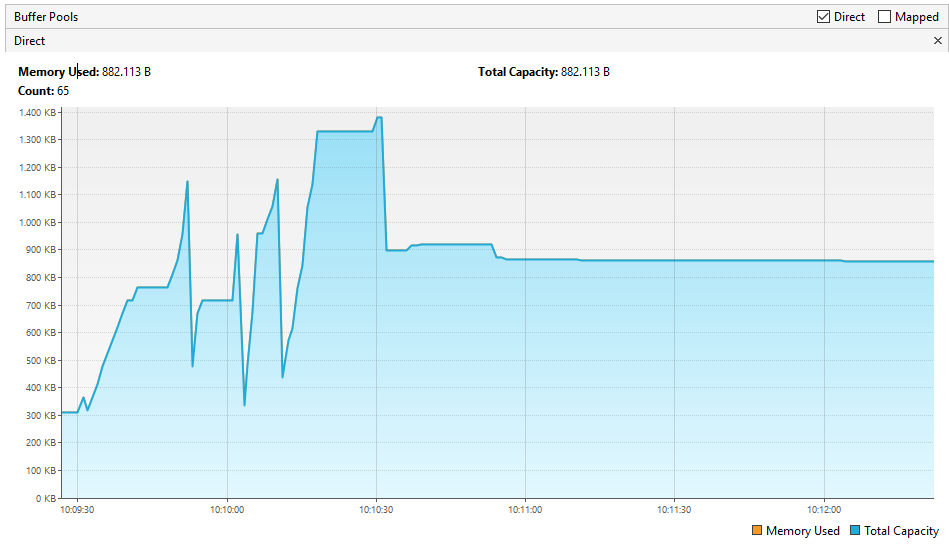
While this represents the behavior with version 6.0.X:
Comment From: snicoll
Can you please attach a small sample that demonstrates the leak as you've described. Please make sure you're using the same Undertow version in both cases.
Comment From: giuseppemilicia
Below is an application that reproduces the issue. Additionally, it is necessary to define an executor within the Spring context, along with Undertow, to encounter the problem:
@SpringBootApplication
public class DemoApplication {

    public static void main(String[] args) {
        SpringApplication.run(DemoApplication.class, args);
    }

    @RestController
    public static class IssueController {
        @GetMapping
        public ResponseEntity<StreamingResponseBody> example() {
            return ResponseEntity.ok()
                    .body(out -> out.write(new byte[16384]));
        }
    }

    @Configuration
    public static class ExecutorConfig {
        @Bean
        public ThreadPoolTaskExecutor executor() {
            ThreadPoolTaskExecutor executor = new ThreadPoolTaskExecutor();
            executor.initialize();
            return executor;
        }
    }

}
Dependencies in the pom.xml:
    <parent>
        <groupId>org.springframework.boot</groupId>
        <artifactId>spring-boot-starter-parent</artifactId>
        <version>3.3.2</version>
        <relativePath/> <!-- lookup parent from repository -->
    </parent>
    <dependencies>
        <dependency>
            <groupId>org.springframework.boot</groupId>
            <artifactId>spring-boot-starter-web</artifactId>
            <exclusions>
                <exclusion>
                    <groupId>org.springframework.boot</groupId>
                    <artifactId>spring-boot-starter-tomcat</artifactId>
                </exclusion>
            </exclusions>
        </dependency>
        <dependency>
            <groupId>org.springframework.boot</groupId>
            <artifactId>spring-boot-starter-undertow</artifactId>
        </dependency>
    </dependencies>
Comment From: simonbasle
I have attempted to reproduce with the above snippet, without seeing a definitive increase in non-heap memory usage like in your screenshot. It is unclear however how you observe these results (profiling tooling / how are the request executed / etc...).
I'm not sure what we can do at this point. Since you do observe these, perhaps you could run your reproducer app with a locally checked out spring-framework repository and use git bisect to find around which commit(s) the leak starts to appear?
Comment From: spring-projects-issues
If you would like us to look at this issue, please provide the requested information. If the information is not provided within the next 7 days this issue will be closed.
Comment From: spring-projects-issues
Closing due to lack of requested feedback. If you would like us to look at this issue, please provide the requested information and we will re-open the issue.