ETA: 5 minutes
Hello! 👋
TL;DR
Just add:
.publishOn(Schedulers.boundedElastic())
Somewhere in WebClient internals to improve app performance 😄
Context
Recently i was deep diving into SpringWebFlux + Spring WebClient app to figure out which parts of the code are executed by given thread. It turns out, that if i have cpu bound operation, even as simple as encoding object to json, then they are executed on WebClient threads by default. I've created MVCE App for this. Basically the whole app is something like this:
@GetMapping("/endpoint")
fun endpoint(): Mono<ResponseEntity<AppResponse>> =
    webClient
        .get()
        .uri("http://some-external-service/endpoint")
        .retrieve()
        .bodyToMono(MockServerResponse::class.java)
        // comment this line if needed
        .publishOn(Schedulers.parallel())
        .map {
            heavyCpuOperation()
            it
        }
        .map { ResponseEntity.ok(AppResponse(it.data)) }

private fun heavyCpuOperation() {
    var bigInteger = BigInteger.ZERO
    for (i in 0..500_000) {
        bigInteger = bigInteger.add(BigInteger.valueOf(i.toLong()))
    }
}
Here are the results:
- Logs, where there is no
.publishOn()operator
reactor-http-nio-3 ### com.nalepa.publishon.AppEndpoint ###
reactor-http-nio-3 ### com.nalepa.publishon.AppEndpoint ### ENDPOINT: Start processing request
http-client-nio-2 ### io.netty.channel.DefaultChannelPipeline$HeadContext ### Writing data to socket
http-client-nio-2 ### org.springframework.http.codec.json.Jackson2JsonDecoder ### Decoding webClient response
http-client-nio-2 ### com.nalepa.publishon.AppEndpoint ### WEBCLIENT: I hava response from external service
http-client-nio-2 ### com.nalepa.publishon.AppEndpoint ### CPU OPERATION: Started heavy operation
http-client-nio-2 ### com.nalepa.publishon.AppEndpoint ### CPU OPERATION: Ended heavy operation
http-client-nio-2 ### org.springframework.http.codec.json.Jackson2JsonEncoder ### Encoding endpoint response
reactor-http-nio-3 ### io.netty.channel.DefaultChannelPipeline$HeadContext ### Writing data to socket
http-client-nio-2 ### com.nalepa.publishon.AppEndpoint ### ENDPOINT: Ended processing request
- Logs, where there is
.publishOn(Schedulers.parallel())operator
reactor-http-nio-4 ### com.nalepa.publishon.AppEndpoint ###
reactor-http-nio-4 ### com.nalepa.publishon.AppEndpoint ### ENDPOINT: Start processing request
http-client-nio-2 ### io.netty.channel.DefaultChannelPipeline$HeadContext ### Writing data to socket
http-client-nio-2 ### org.springframework.http.codec.json.Jackson2JsonDecoder ### Decoding webClient response
http-client-nio-2 ### com.nalepa.publishon.AppEndpoint ### WEBCLIENT: I hava response from external service
parallel-1 ### com.nalepa.publishon.AppEndpoint ### CPU OPERATION: Started heavy operation
parallel-1 ### com.nalepa.publishon.AppEndpoint ### CPU OPERATION: Ended heavy operation
parallel-1 ### org.springframework.http.codec.json.Jackson2JsonEncoder ### Encoding endpoint response
parallel-1 ### com.nalepa.publishon.AppEndpoint ### ENDPOINT: Ended processing request
reactor-http-nio-4 ### io.netty.channel.DefaultChannelPipeline$HeadContext ### Writing data to socket
As you can see, CPU Operation is executed on http thread when there is no .publishOn(). I've decided to perform some tests related to this.
Few words about testing
Dependencies used:
- Spring Boot 3.4.1
- Java 21
Platform: - MacBook Air M2, 16GB RAM
Testing App: - Here's the repo
I know, that for testing it's good to tests many scenarios, many schedulers etc. I've done that. In this issue, I'm putting results for so called Base and Complex scenario. Also, maybe I'm missing something and those tests simply does not make any sense, if yes, please let me know!
In tests, i was also ignoring like first 2-3 minutes of results, due to JVM warmup.
Performance Testing
I've decided to perform some tests to find out, if there will be any performance improvement by publishing webClient response on another scheduler.
Base Scenario
I've started with simpliest one:
@GetMapping("/endpoint")
fun endpoint(): Mono<ResponseEntity<String>> =
    webClient
        .get()
        .uri("http://some-external-service/endpoint")
        .retrieve()
        .bodyToMono(String::class.java)
        .map { ResponseEntity.ok(it) }
Here's the architecture diagram:
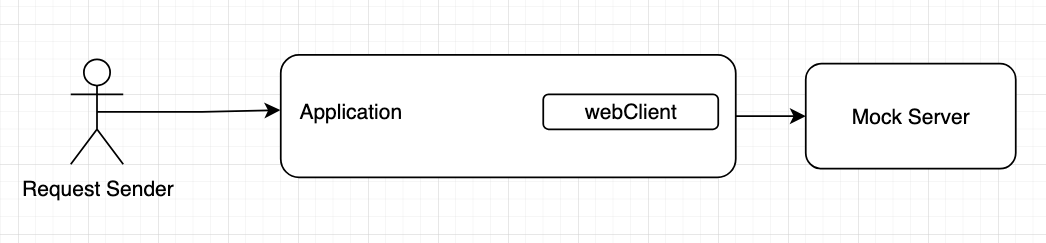
So basically the flow is something like:
1. Send `only one` request to an app
2. App get data from mock server by using `only one` WebClient.
3. Go to step 1
I've run this scenario in 3 variants:
- without .publishOn()
- with .publishOn(Schedulers.parallel())
- with .publishOn(Schedulers.boundedElastic())
For every one of them the results were similar, so I will post only one screenshot from Grafana.
- About 8K RPS sum by (instance) (irate(http_server_requests_seconds_count[15s]))
- About 5% CPU Usage max by (instance) (process_cpu_usage)
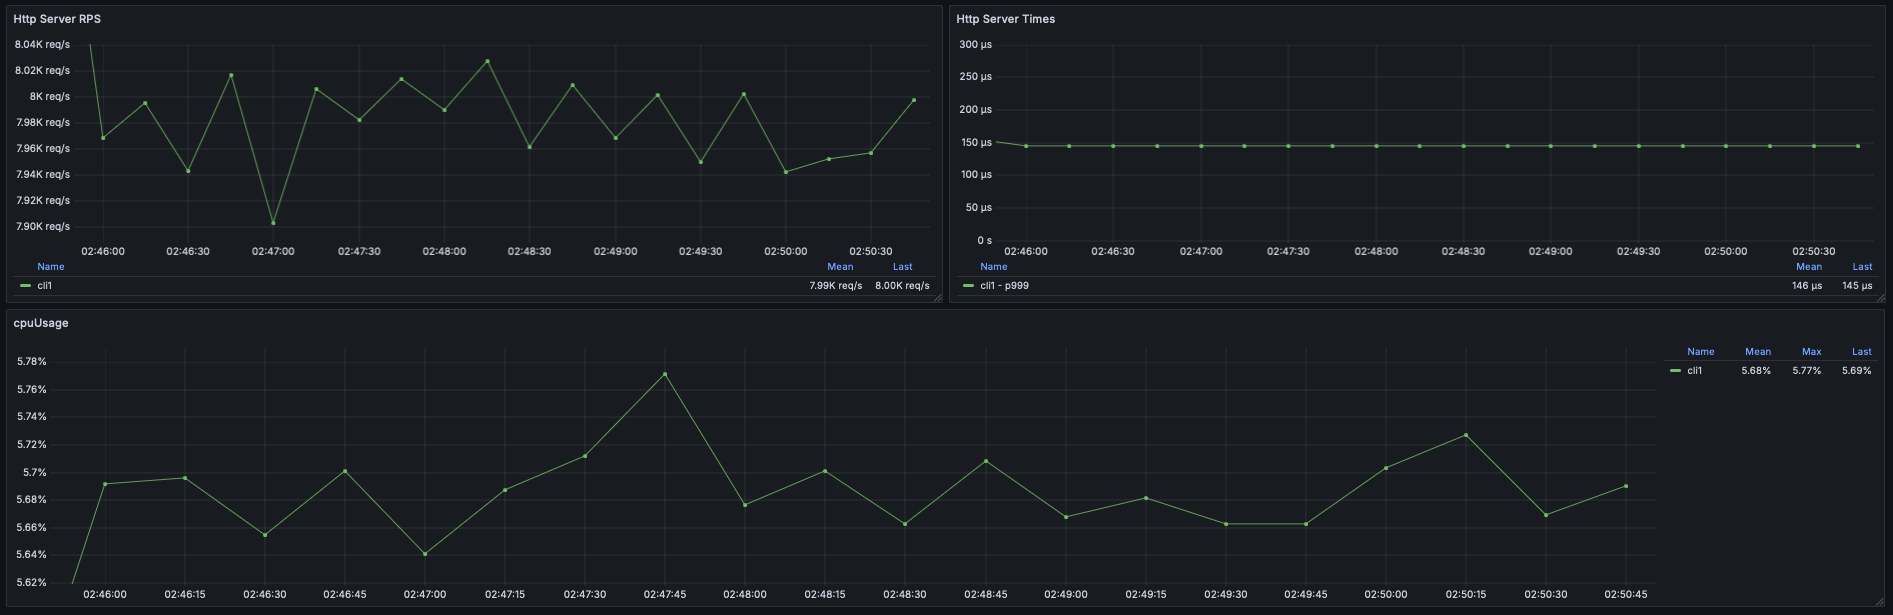
So it's good to know, that adding .publishOn() did not has any impact on the simpliest app.
Complex Scenario
I've added:
- decoding response from Mock Server:
data class MockServerResponse(
    val value: String,
)
- encoding response from an
TestAppby simply returningList<String>
So now app looks like this:
@GetMapping("/endpoint")
fun endpoint(): Mono<ResponseEntity<List<String>>> =
    Flux
        .fromIterable(webClients)
        .flatMap {
            it
                .getResponseFromWebClient()
                // comment if needed
                .publishOn(Schedulers.boundedElastic())
        }
        .collectList()
        .map { ResponseEntity.ok(it) }
I've also changed a little bit architecture. Here's the diagram:
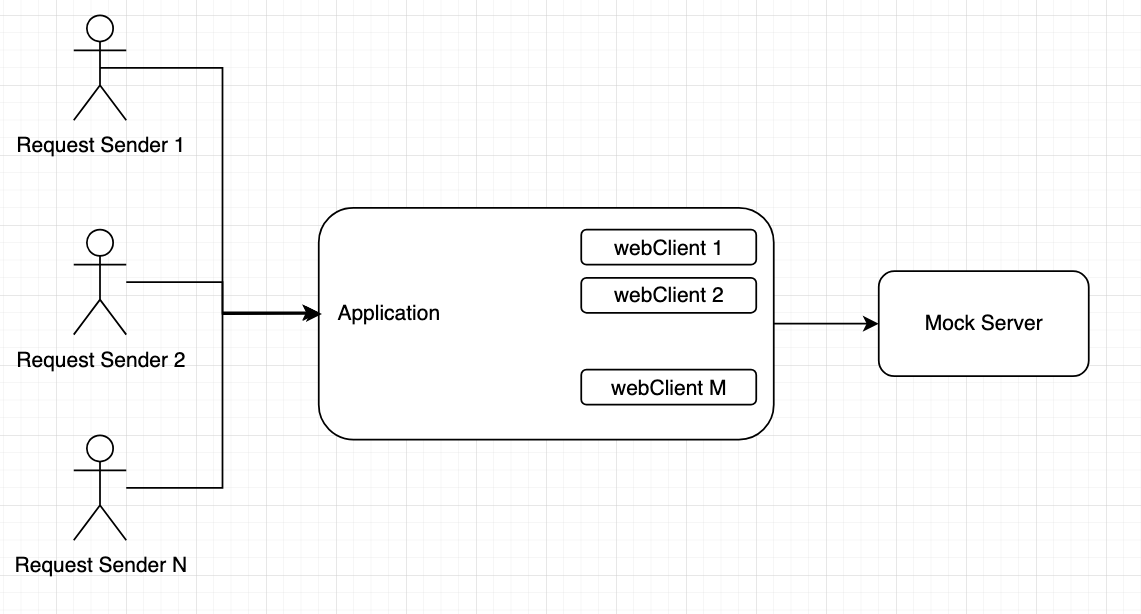
So basically the flow is something like:
1. Send `N` requests to an app
2. For every request app get data from mock server by using `M` WebClients.
3. Go to step 1
I've run this scenario in 3 variants:
- without .publishOn()
- with .publishOn(Schedulers.parallel())
- with .publishOn(Schedulers.boundedElastic())
Results where there is no .publishOn() or there isSchedulers.parallel() were similar:
- About 240 RPS sum by (instance) (irate(http_server_requests_seconds_count[15s]))
- About 33% CPU Usage max by (instance) (process_cpu_usage)
- About 260 ms response times max by (instance) (http_server_requests_seconds{uri="/dummy/{id}", quantile="0.999"})
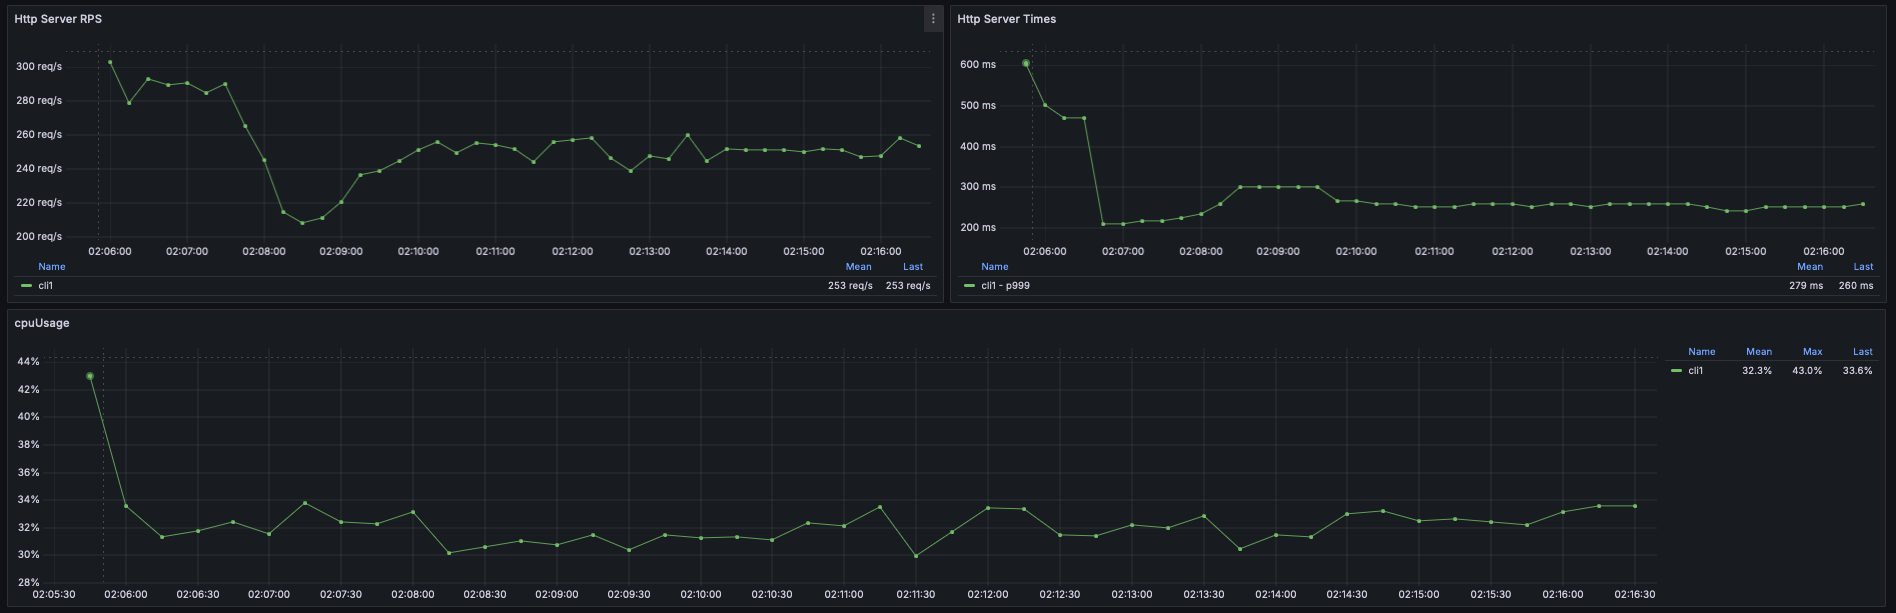
Results for .publishOn(Schedulers.boundedElastic()) were better:
- About 300 RPS sum by (instance) (irate(http_server_requests_seconds_count[15s]))
- About 53% CPU Usage max by (instance) (process_cpu_usage)
- About 185 ms response times max by (instance) (http_server_requests_seconds{uri="/dummy/{id}", quantile="0.999"})
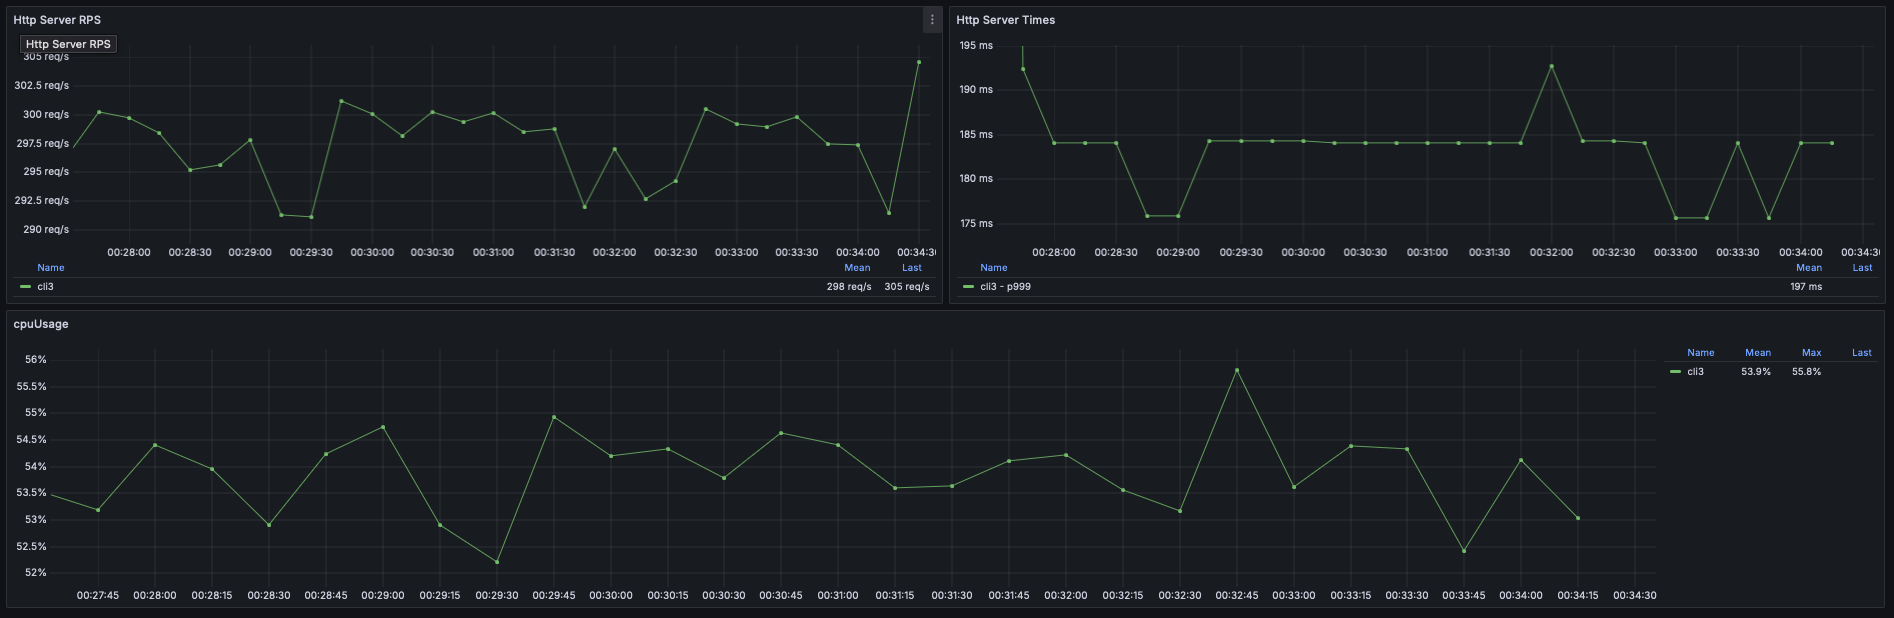
So adding .publishOn(Schedulers.boundedElastic()) bring performance benefits! ❤️
- RPS: ~240 -> ~300
- CPU Usage: ~33% -> ~53%
- Response times: ~260 ms -> 185 ms
Based on my tests i would say, that when all Web Client threads are executing cpu bound operations, then using .boundedElastic() shines ❤️
Few words about Schedulers
As far as I know:
- parallel - every thread has it's own task queue
- boundedElastic - every thread share one task queu
I did also an comparison:
Schedulers.newBoundedElastic(
    Runtime.getRuntime().availableProcessors(), 100_000, "customBounded"
)
vs
Schedulers.newParallel(
    "customParallel", Runtime.getRuntime().availableProcessors(),
)
BoundedElastic was also better in that case.
I've tried to find out why and I have no answer for that.
Maybe:
- it's related with task queue?
- those threads are blocking/synchronizing somewhere? Project Reactor Docs Schedulers says, that .parallel() should not execute blocking code
Question
What do you think about publishing response from webClient on .boundedElastic() by default?
Also, with possibility to overwrite or disable it.
Proposal
I've focused only on WebClient.Builder API due to fact, that imo this is more important from programming experience than the internals.
fun create(number: Int, size: String): WebClient =
    webClientBuilder
        // disable this new option
        .disablePublishResponseOnAnotherThread()
        // publish response on another scheduler
        .publishResponseOn(schedulerProvidedByProgrammer)
        .build()
Alternatives
In my tests, i was just adding .publishOn() after getting response from WebClient. But WebClient threads are also decoding response from downstream service. Maybe we should use .publishOn() even before that deserializing?
Also, if those tests makes sense, maybe you will be able to provide some another tests, just to double confirm results?
I didn't checked database clients, but maybe they are working in the samy way?
Summary
Publishing WebClient response on .boundedElatic() bring performance improvement. It leads to:
- shorter response times
- higher RPS
- higher CPU usage
Please let me know what do you think about all of this 😄
Comment From: bclozel
I believe this is by design in Reactor. Spring Framework does not choose the default scheduling strategy in Reactor. We only switch to other schedulers when the operation performed is doing blocking I/O and could block worker threads.
I think the rationale here is that the vast majority of HTTP exchanges are I/O bound (the HTTP stack, other remote calls and database calls). For this case, the current server thread is the best choice for performance reasons. While this didn't show in your benchmarks, scheduling exchanges on the bounded elastic scheduler will probably cause artificial context switches and waste resources.
I agree that scheduling differently some exchanges is a good idea, especially if the processing is CPU bound. If the workload is truly CPU bound, then Schedulers.parallel() would probably be the best choice since it aligns with the number of CPU cores. boundedElatic() should be mostly used for blocking I/O operations as scheduling CPU bound work on this one might also cause unnecessary context switches.
In summary, I don't think we will change this behavior nor promote this concept in our API. I'll close this issue for now and ping @chemicL in case he's got a different opinion.
Thanks for your report @mateusz-nalepa !
Comment From: mateusz-nalepa
Hello @bclozel ! Thank for your repsonse!
Spring Framework does not choose the default scheduling strategy in Reactor.
Ok, i thought that Spring do that. For example:
org.springframework.web.server.session.InMemoryWebSessionStore#createWebSession

@Override
public Mono<WebSession> createWebSession() {

    // Opportunity to clean expired sessions
    Instant now = this.clock.instant();
    this.expiredSessionChecker.checkIfNecessary(now);

    return Mono.<WebSession>fromSupplier(() -> new InMemoryWebSession(now))
            .subscribeOn(Schedulers.boundedElastic())
            .publishOn(Schedulers.parallel());
}
But as you said, there is probably a good reason for that 😄
FYI
Regarding context switches
I've learned someday, that there are things like:
Thread context switch Vs. process context switch
When i was using bfptrace to analyze application I found out, that for some random setup Context Switch happens ~6 times more often than Process Context Switch 😄
I've used Lenovo Y580 for this testing.
Ok, I'm waiting for @chemicL response! 🫡
Comment From: mateusz-nalepa
I've decided to execute yet another tests 😄
My previous tests were run by using ReactorClientHttpConnector.
I've ran now test by using HttpComponentsClientHttpConnector, which has dedicated thread pool for every client, in two variants:
- without .publishOn()
- RPS 270
- CPU Usage: 50%
- Response Times: 210 ms
- with .publishOn(boundedElastic())
- RPS 280
- CPU Usage: 55%
- Response Times: 200 ms
So there is a little difference.
I would risk a statement that: - under low load - context switches may be artificial - under high load - it's bring performance benefits cause, well, http client threads are executing only http related code
Comment From: mateusz-nalepa
@bclozel you are right about wasting resources on context switches! 🚀
Little Change
I've changed code from:
@GetMapping("/endpoint")
fun endpoint(): Mono<ResponseEntity<List<MockServerResponse>>> =
    Flux
        .fromIterable(webClients)
        .flatMap {
            it
                .getResponseFromWebClient()
                .publishOn(Schedulers.boundedElastic())
        }
        .collectList()
        .map { ResponseEntity.ok(it) }
to:
@GetMapping("/endpoint")
fun endpoint(): Mono<ResponseEntity<List<MockServerResponse>>> =
    Flux
        .fromIterable(webClients)
        .flatMap {
            it
                .getResponseFromWebClient()
        }
        .collectList()
        .map { ResponseEntity.ok(it) }
        .publishOn(Schedulers.boundedElastic())
So .publishOn() is the last last in the code from the endpoint perspective.
And the results are: - RPS: 340 - CPU Usage: 50% - Response Times: 165 ms
What's even more interesting:
Now, for .parallel() the results were almost identical 🤯
So it looks like, that:
- context switches are painful
- there are less painful, when i was using boundedElastic in previous version, i mean, .publishOn() right after webClient response
By looking at the metrics related with encoding response to json:
org.springframework.http.codec.json.AbstractJackson2Encoder
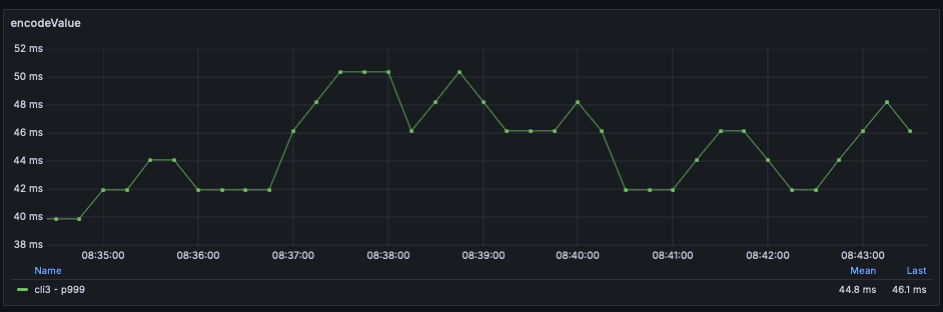
It looks like, that http client threads without .publishOn() are doing this serialization instead of getting and processing response from downstream service 😄
Furthermore
After switch, there is no blocking operations, cause in this new case, parallel and boundedElastic works the same way, so, from my side its 🤦 But why? Based on my issue:
...
parallel-1 ### org.springframework.http.codec.json.Jackson2JsonEncoder ### Encoding endpoint response
parallel-1 ### com.nalepa.publishon.AppEndpoint ### ENDPOINT: Ended processing request
reactor-http-nio-4 ### io.netty.channel.DefaultChannelPipeline$HeadContext ### Writing data to socket
It looks like, that:
- preparing response - like serializing object to json is done on parallel, boundedElastic
- writing response to socket is done on eventLoop thread
Even the code says that 🤦
io.netty.channel.AbstractChannelHandlerContext#write(java.lang.Object, boolean, io.netty.channel.ChannelPromise)
Basically it looks like something like this:
if (executor.inEventLoop()) {
    writeAndFlushResponse()
} else {
   executor.submitTask()
}
So performance benefit it's still one line, but in another place 😄 So to summarize initial code vs .publishOn as the last line in the endpoint:
- RPS: ~240 -> ~340
- CPU Usage: ~33% -> ~50%
- Response times: ~260 ms -> 165 ms
So in production apps i think, it's good to add .publishOn() after we get data from all sources 😄
Comment From: chemicL
Hey, I just noticed I missed a notification about this. Thanks for providing the demo code @mateusz-nalepa. This use case is quite similar to something we recently addressed with r2dbc drivers (summarized here). Let me explain my understanding.
In case of the client -> mock server interaction, serialization on the client side happens in the following places: - (1) incoming to the client - the server deserializes the end user request (A) - (2) outgoing from the WebClient to the mock server - request (B) (N times) - (3) incoming in the WebClient - response (B) (N times) - (4) outgoing from the client - the server deserializes response (A) for end user to consume
You managed to optimize step (4). With no offloading, the last response from (3) serializes the aggregation of the list of response (B) into the response (A). The following end user requests have to wait until that step is done on one of the event loops used. Since you offload that to another thread pool, you are able to increase the throughput by more evenly distributing the overall load.
It must be noted that it's quite a specific scenario of aggregating multiple streams and won't affect most request-response use cases. Furthermore, I suspect the impact on serialization is that the payload is not trivial.
One more note here is that in case of reactor-netty there is the mechanism of sharing the server event loop with the client event loop.
I don't know what I'd recommend though. Perhaps hierarchical serialization would do the trick without the need to offload the work to another pool? It's definitely a globally applicable improvement to just add publishOn(Schedulers.boundedElastic()) to WebClient core.
@bclozel potentially there could be a way to delegate the serialization of the final response to the event loop that's handling the server side instead of using the continuation on the WebClient's event loop? I don't know enough about the internals and the interaction with the underlying driver. @violetagg do you have any hints whether any of this makes sense? :)