Hello,
Bug description We discovered a memory leak after a few days we've put our application into production. Native memory usage is growing slowly until it crashes with an OutOfMemory error.
Environment Linux or MacOSX Spring AI 1.0.0-SNAPSHOT as of 2024-09-27 Java 21 Using EmbeddingModel.embed() Model huggingface.co/intfloat/multilingual-e5-small
Steps to reproduce
while (true) {
    embeddingModel.embed("some text to embed");
}
Observe process RAM usage grow slowly. It sometimes decreases a bit (as if some native code got some garbage collection done), but not as much as needed.
Expected behavior Would be cool if it didn't crash in production :-)
Minimal Complete Reproducible example Here is a real simple way to reproduce it:
The application code: https://github.com/slaout/springai-embed-memoryleak-proof/blob/main/src/main/java/com/github/slaout/springai/embed/memoryleak/EmbedderMemoryLeakProof.java The application properties: https://github.com/slaout/springai-embed-memoryleak-proof/blob/main/src/main/resources/application.properties The Maven dependencies: https://github.com/slaout/springai-embed-memoryleak-proof/blob/main/pom.xml
It embeds a random string as fast as possible (but it could also be the same string over and over). JVM RAM is normal and contained. But the java process RAM is leaking. This is the native memory part that is leaking. I think this is PyTorch native executable that is eating all that RAM.
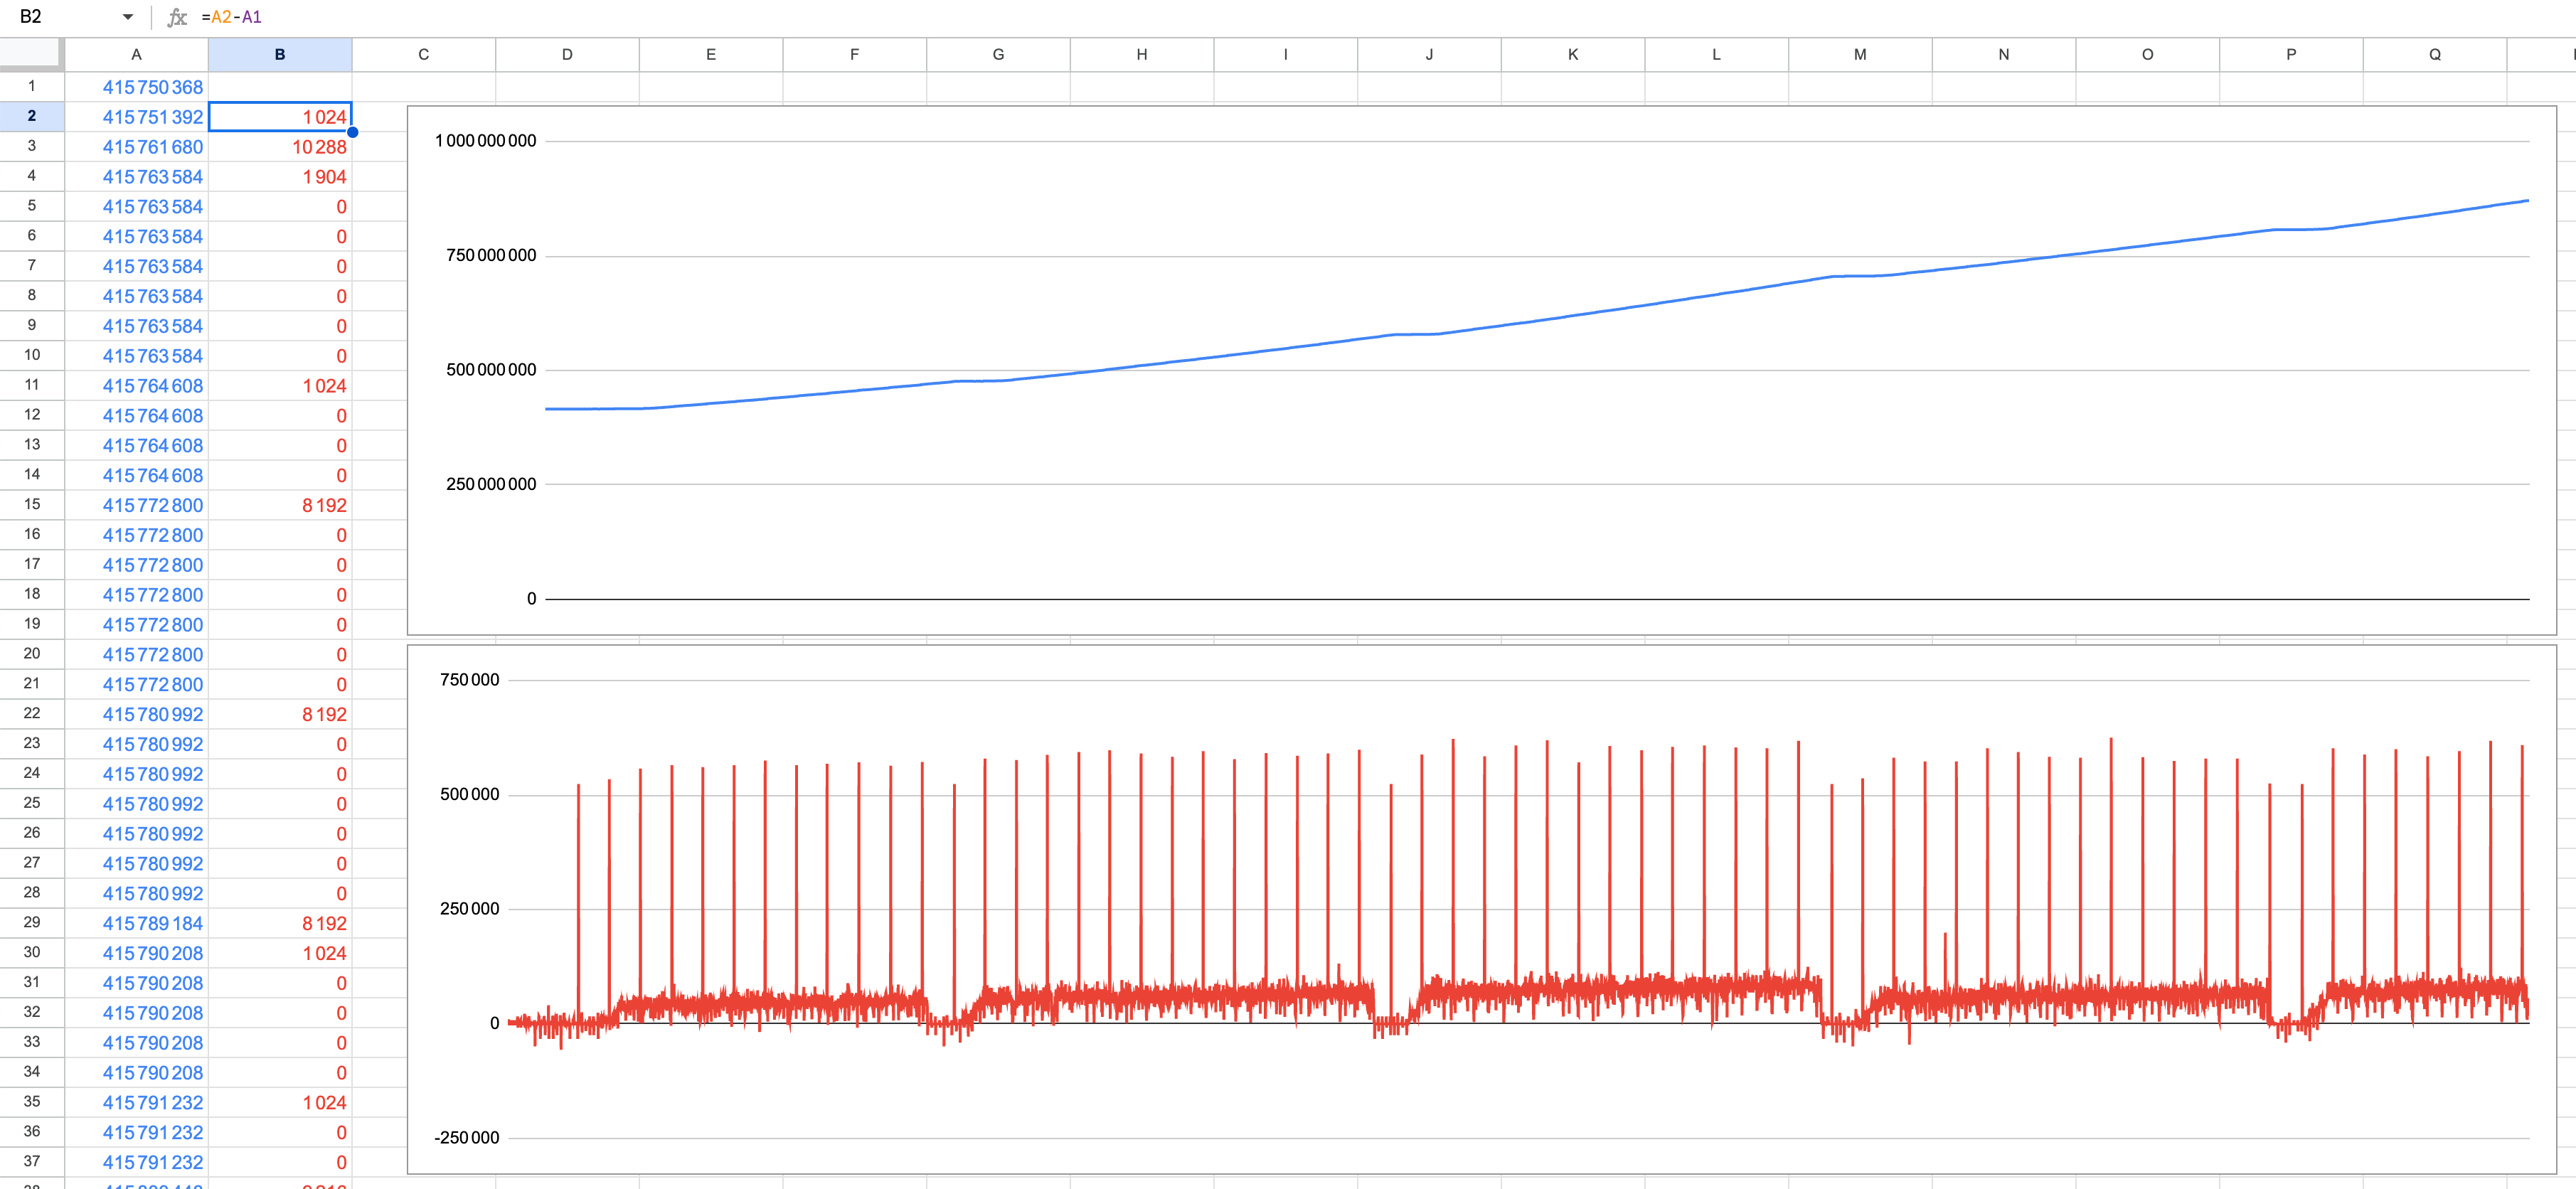
The application prints every seconds the RAM of the "java" Unix process.
If we plot it over more than 2 hours (8000 seconds), RAM alywas increases until it doubles (blue graph).
If we plot the delta from previous seconds (red graph), we see regular increases (and some seldom decreases, below 0) in a pattern.
The "top" command even reported memory growing from 2GB to 27GB during these two ours: Begin :
PID    COMMAND      %CPU      TIME     #TH    #WQ   #PORT MEM    PURG   CMPRS  PGRP  PPID  STATE    BOOSTS               %CPU_ME %CPU_OTHRS
65832  java         830.3     01:48.61 73/9   1     206   2001M+ 0B     1546M- 48338 48338 running  *0[1]                0.00000 0.00000
End : ``` PID COMMAND %CPU TIME #TH #WQ #PORT MEM PURG CMPRS PGRP PPID STATE BOOSTS %CPU_ME %CPU_OTHRS 65832 java 759.5 19:33:43 72/10 1/1 198 27G+ 0B 24G+ 48338 48338 running *0[1] 0.00000 0.00000 ```` Is there anything we can do about it? Would it be Spring AI, DeepJavaLibrary (DJL), OnnxRuntime and/or PyTorch fault?
Comment From: Craigacp
Looks like the inputs to ONNX Runtime aren't being closed, so it's leaking native memory allocated by ORT. I think inputIds, tokenTypeIds and attentionMask should be closed when the result object is closed in a finally at the end of the session.run call.
https://github.com/spring-projects/spring-ai/blob/main/models/spring-ai-transformers/src/main/java/org/springframework/ai/transformers/TransformersEmbeddingModel.java#L260.
Comment From: markpollack
Thanks for debugging this @Craigacp , we will close those OnnxTensors in a finally block