Optimization request
mybatis version : 3.5.8 jdk version : 11
We use async-profiler profile mybatis memory allocation.
found that MetaObject.setValue consume too much memory as following
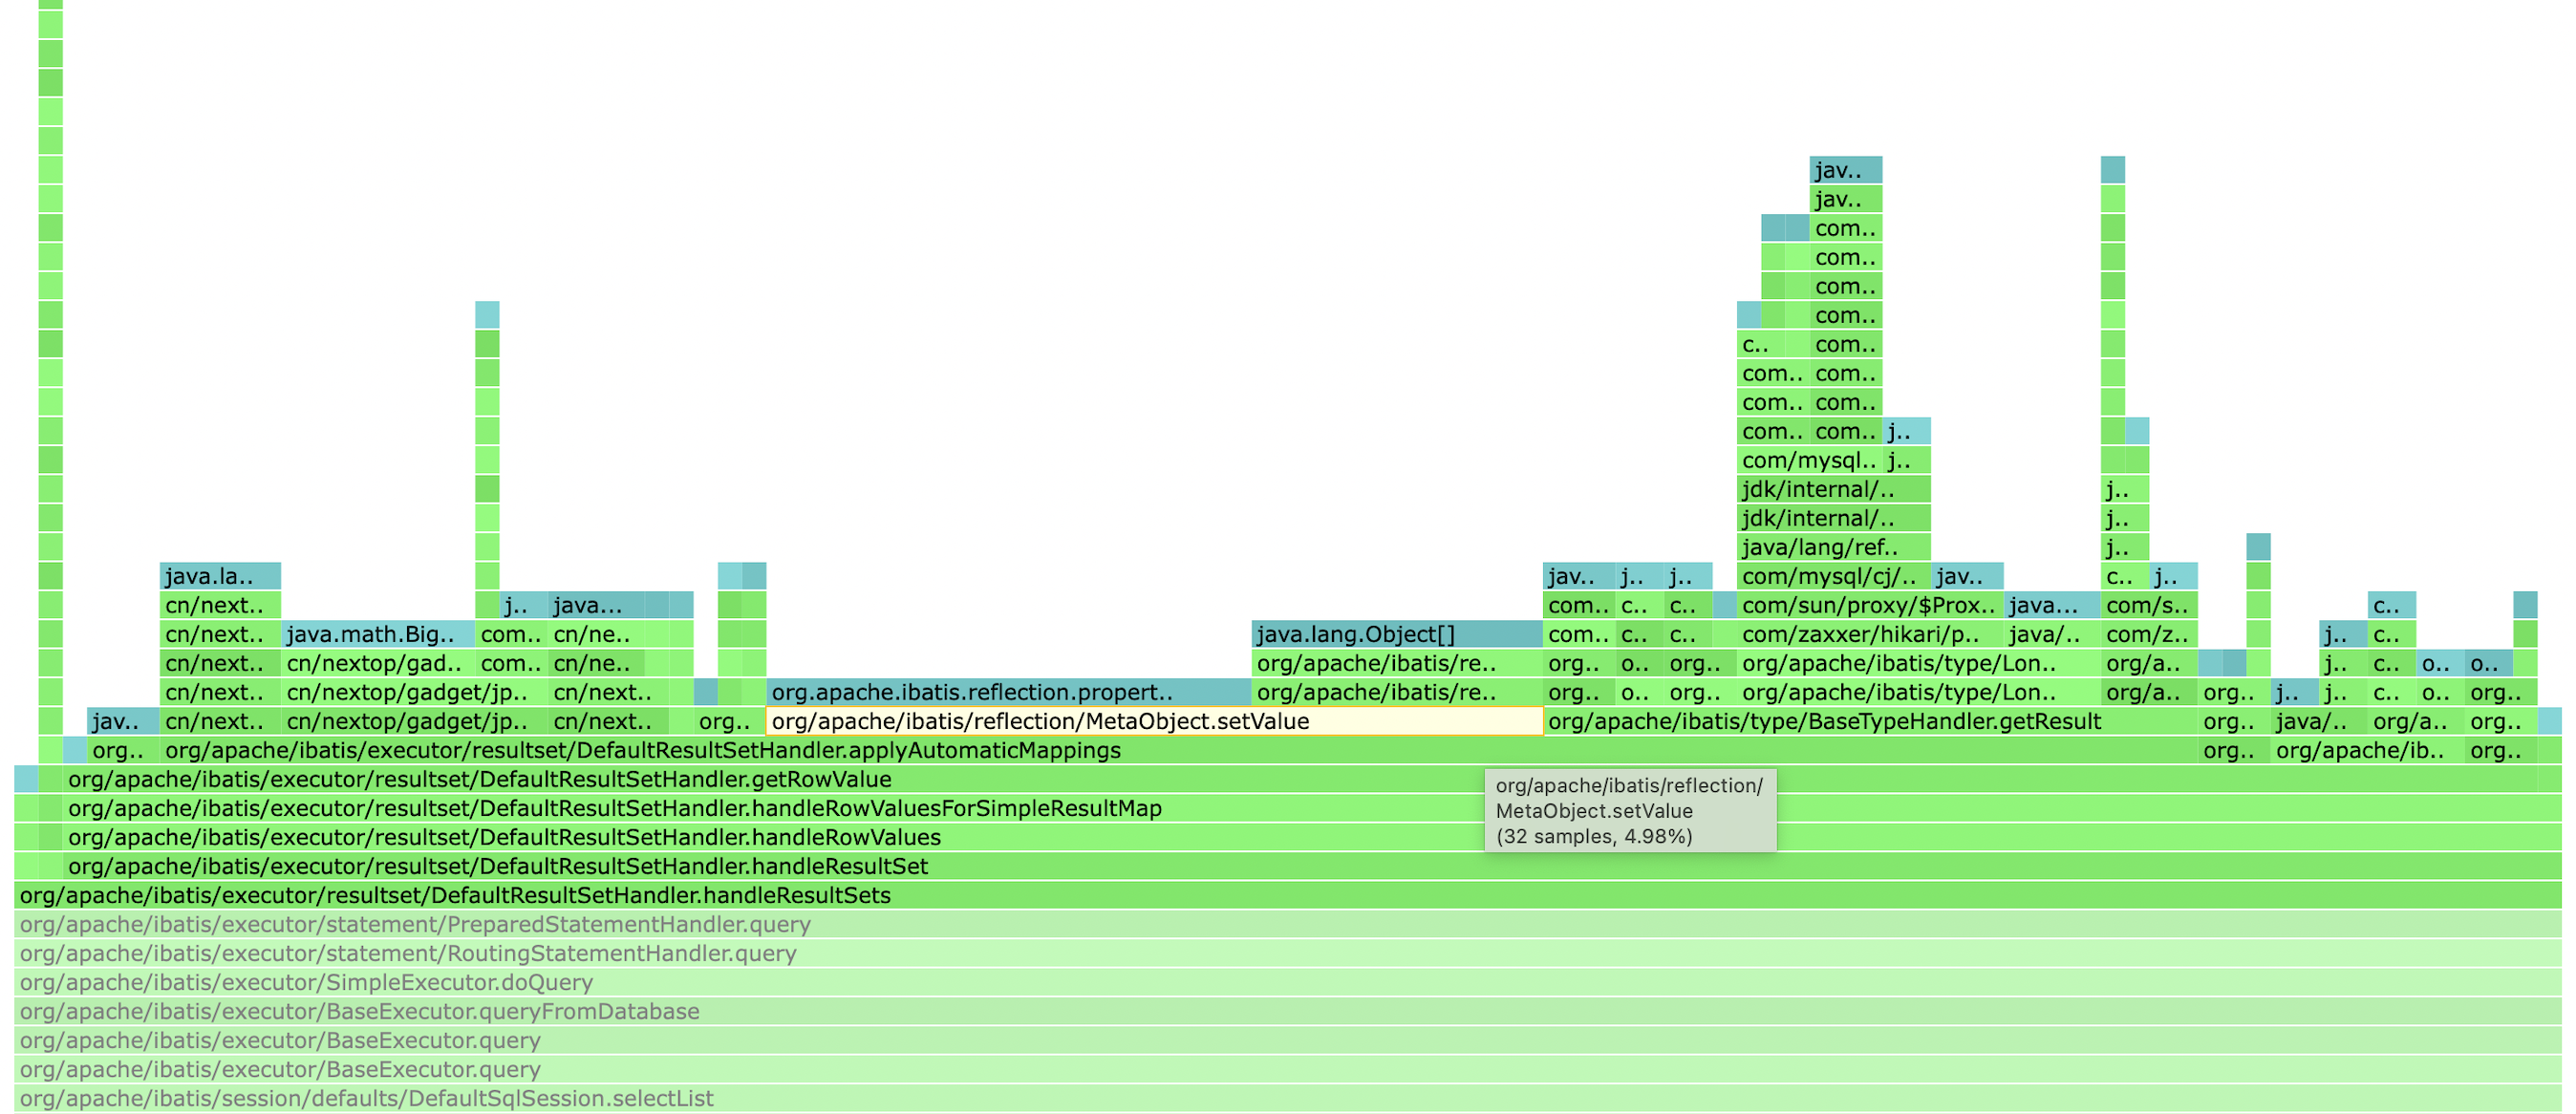
more profile infomation see attachment admin-20211222-02.zip
Comment From: harawata
I'm not sure how we can optimize the method. Any proposition?
Comment From: leonchen83
see pr2436
Comment From: harawata
Thank you for the PR, @leonchen83 !
Please also post 1) the async-profiler result taken after the change is applied and 2) the URL of the repository that contains the test code you used for profiling.
Comment From: leonchen83
@harawata
before change
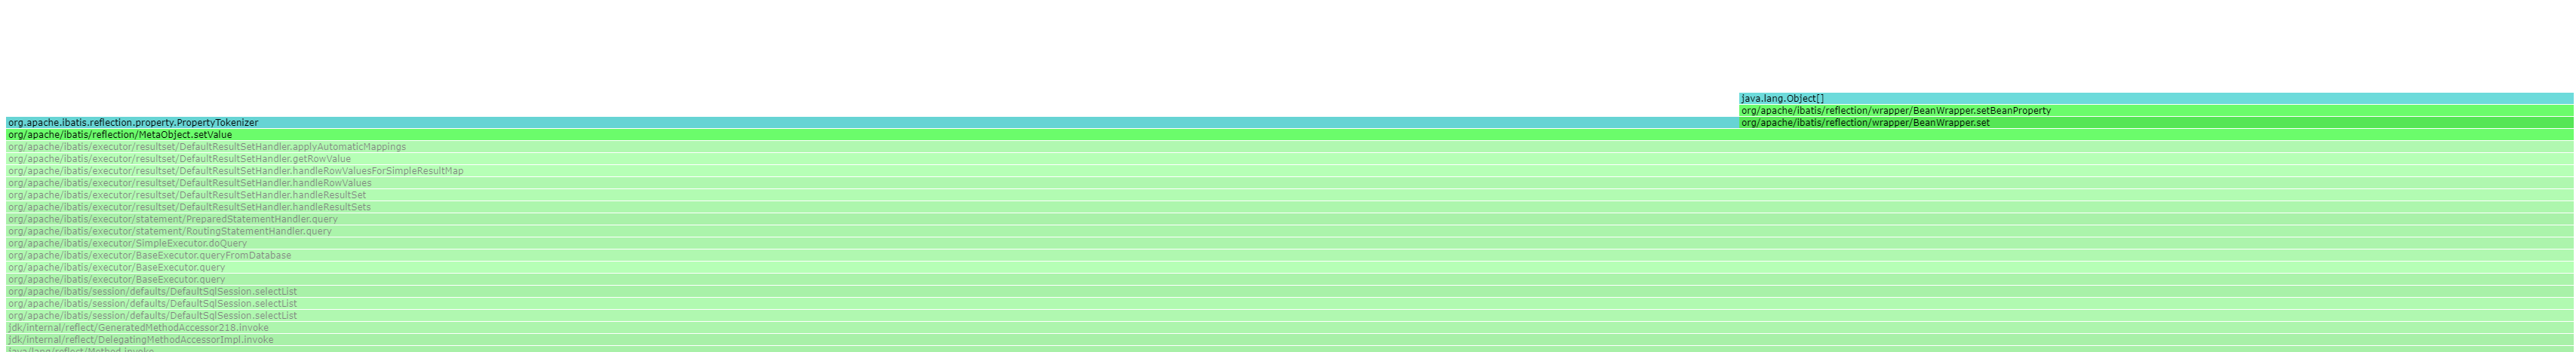
PropertyTokenizer/BeanWrapper.set = 9.57% / 4.61%
after change
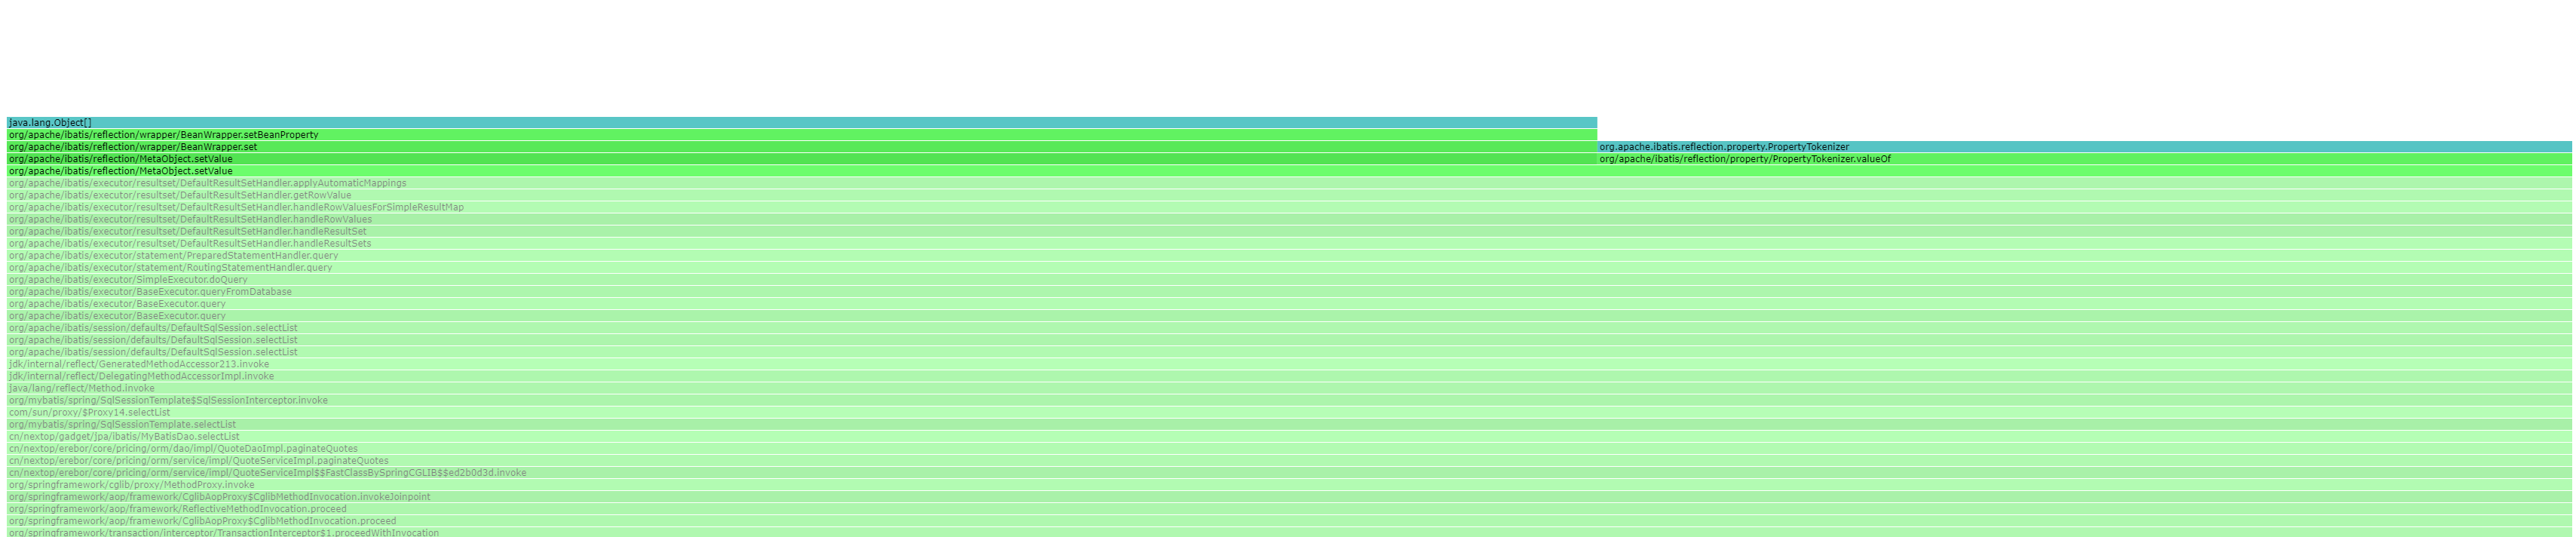
we see that PropertyTokenizer memory usage reduced than before.
origin profiler data see attachment profiler.zip
Comment From: leonchen83
for our code conduct, we can't provide profiling repository. maybe this PR can't be merged. but hope this idea in PR can help you to improve PropertyTokenizer memory usage.
Comment From: harawata
If there is room for improvement, I'm all for it, but we need to verify the effect. It's not good if the proposed optimization is specific to some extreme use case, for example.
If someone experiences the same problem, please provide us with a small demo project so that we can verify the difference.