GORM Playground Link
https://github.com/go-gorm/playground/pull/161
Description
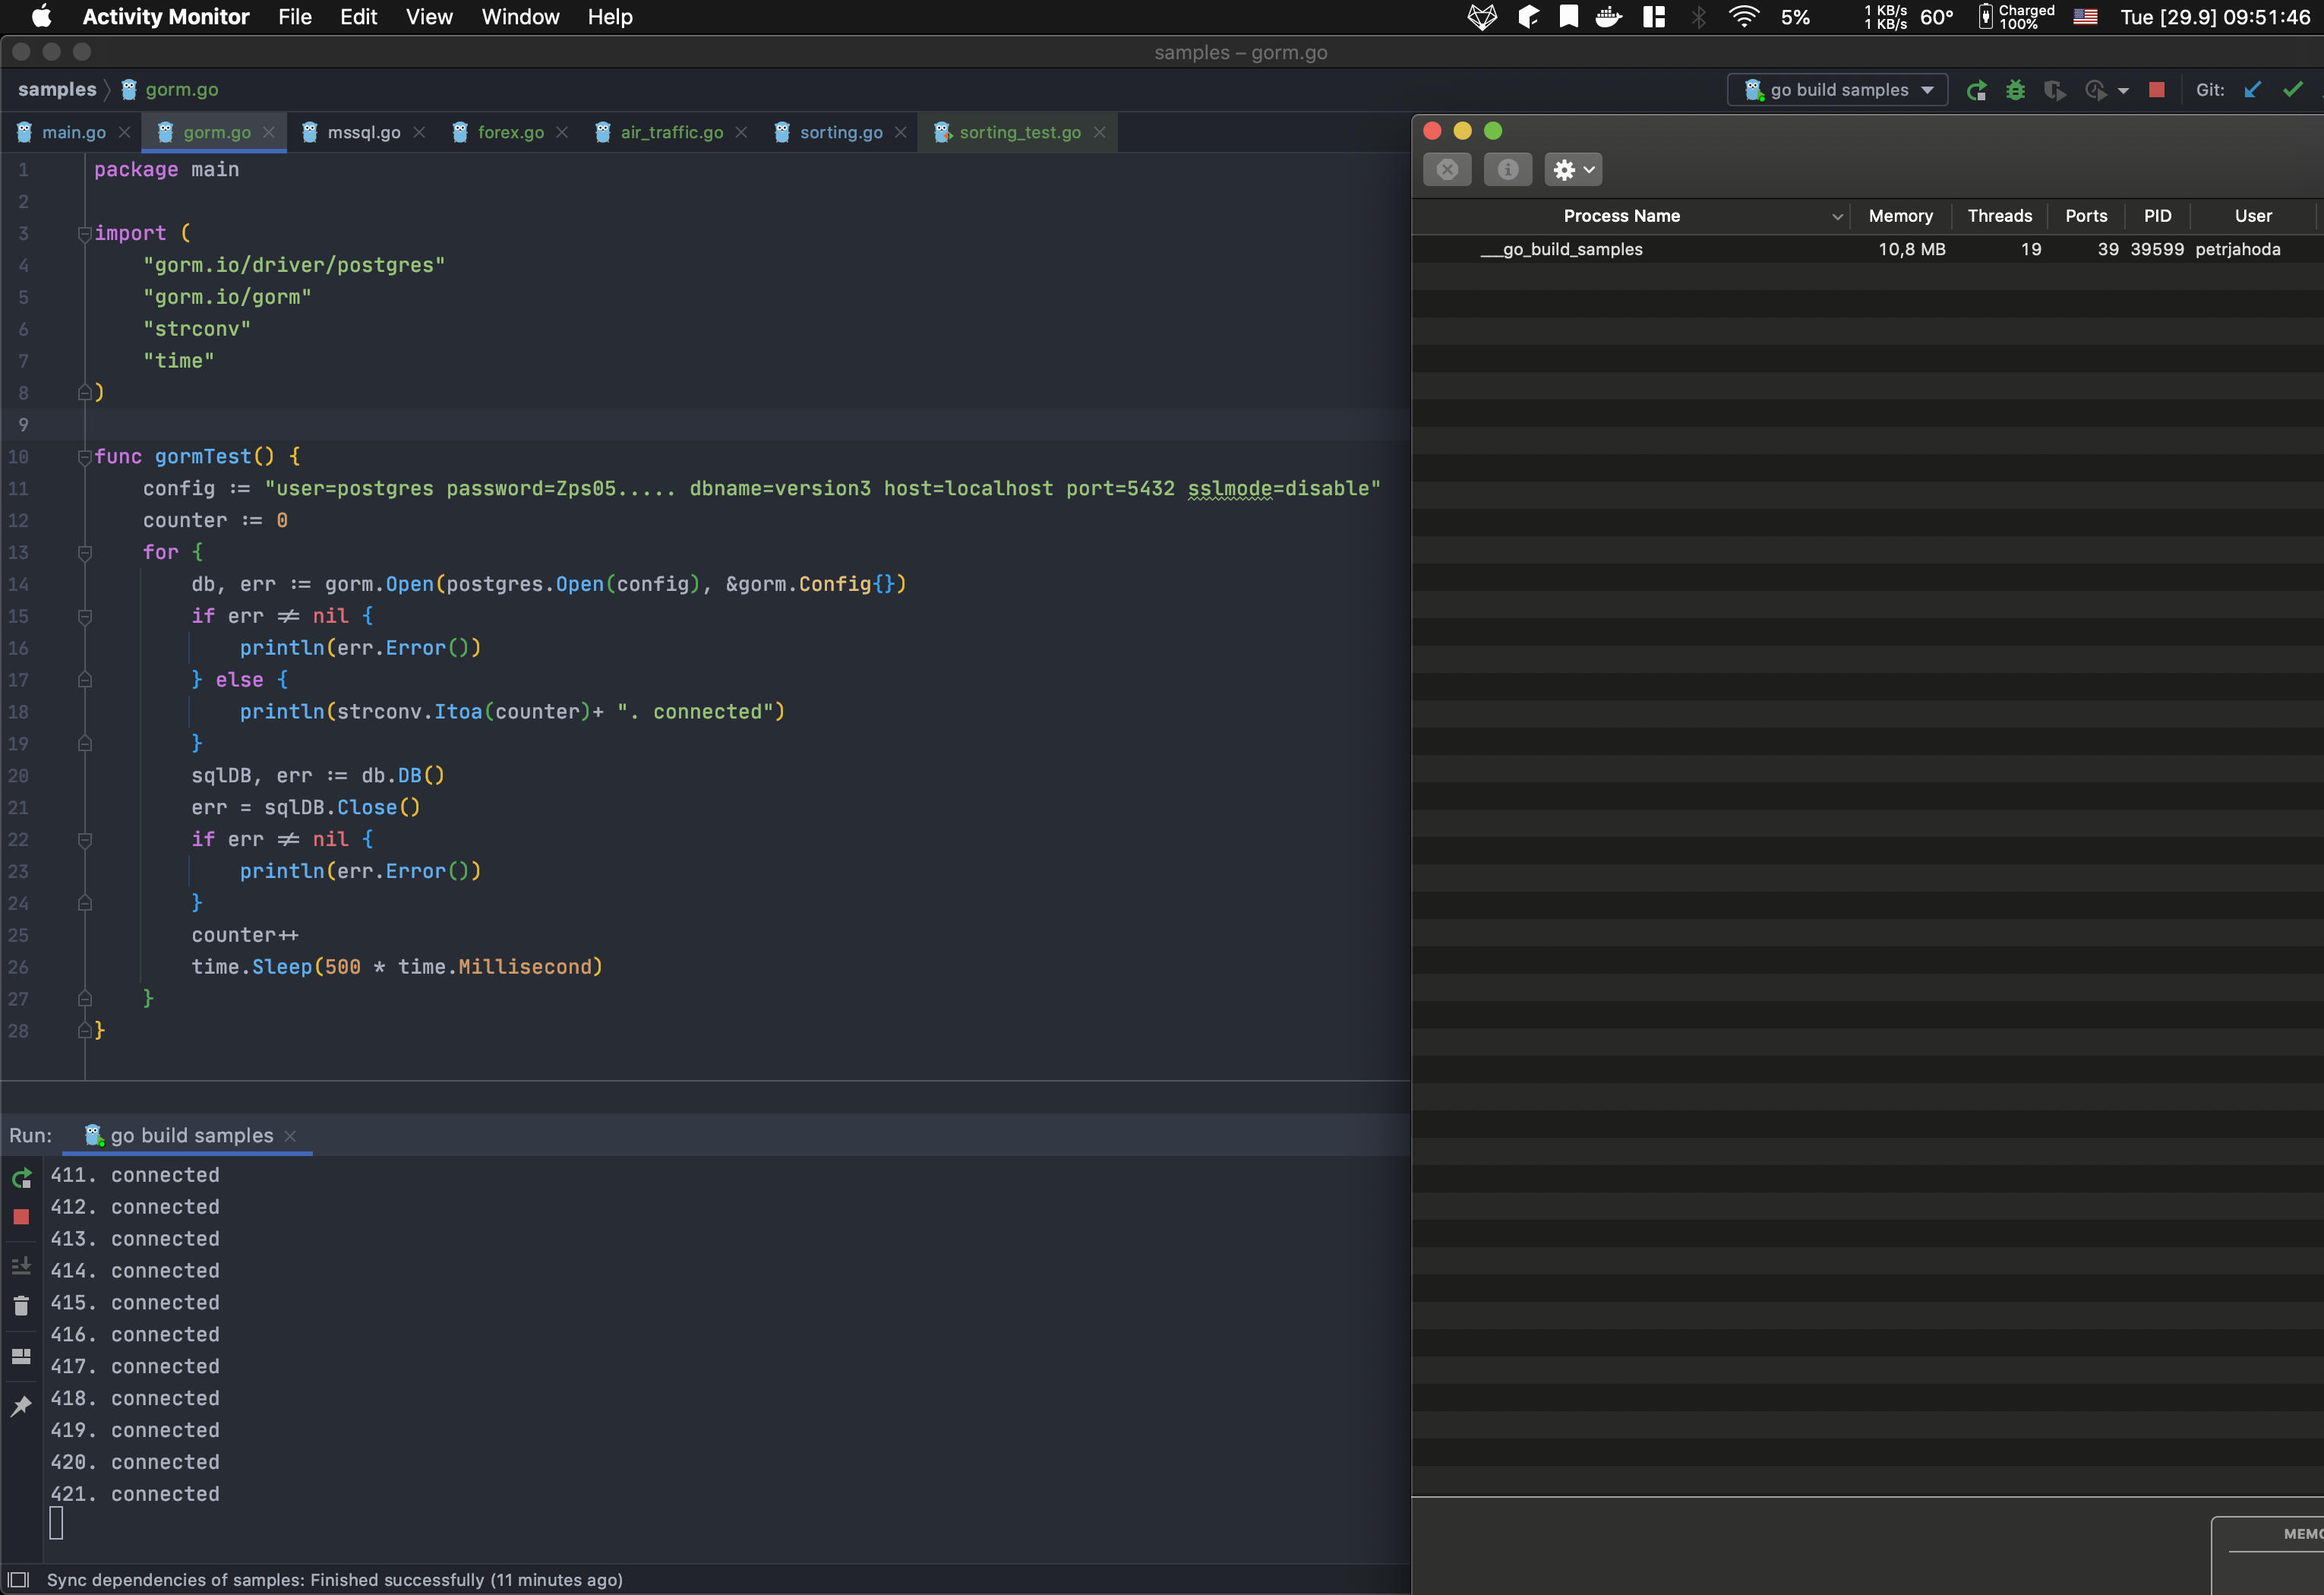
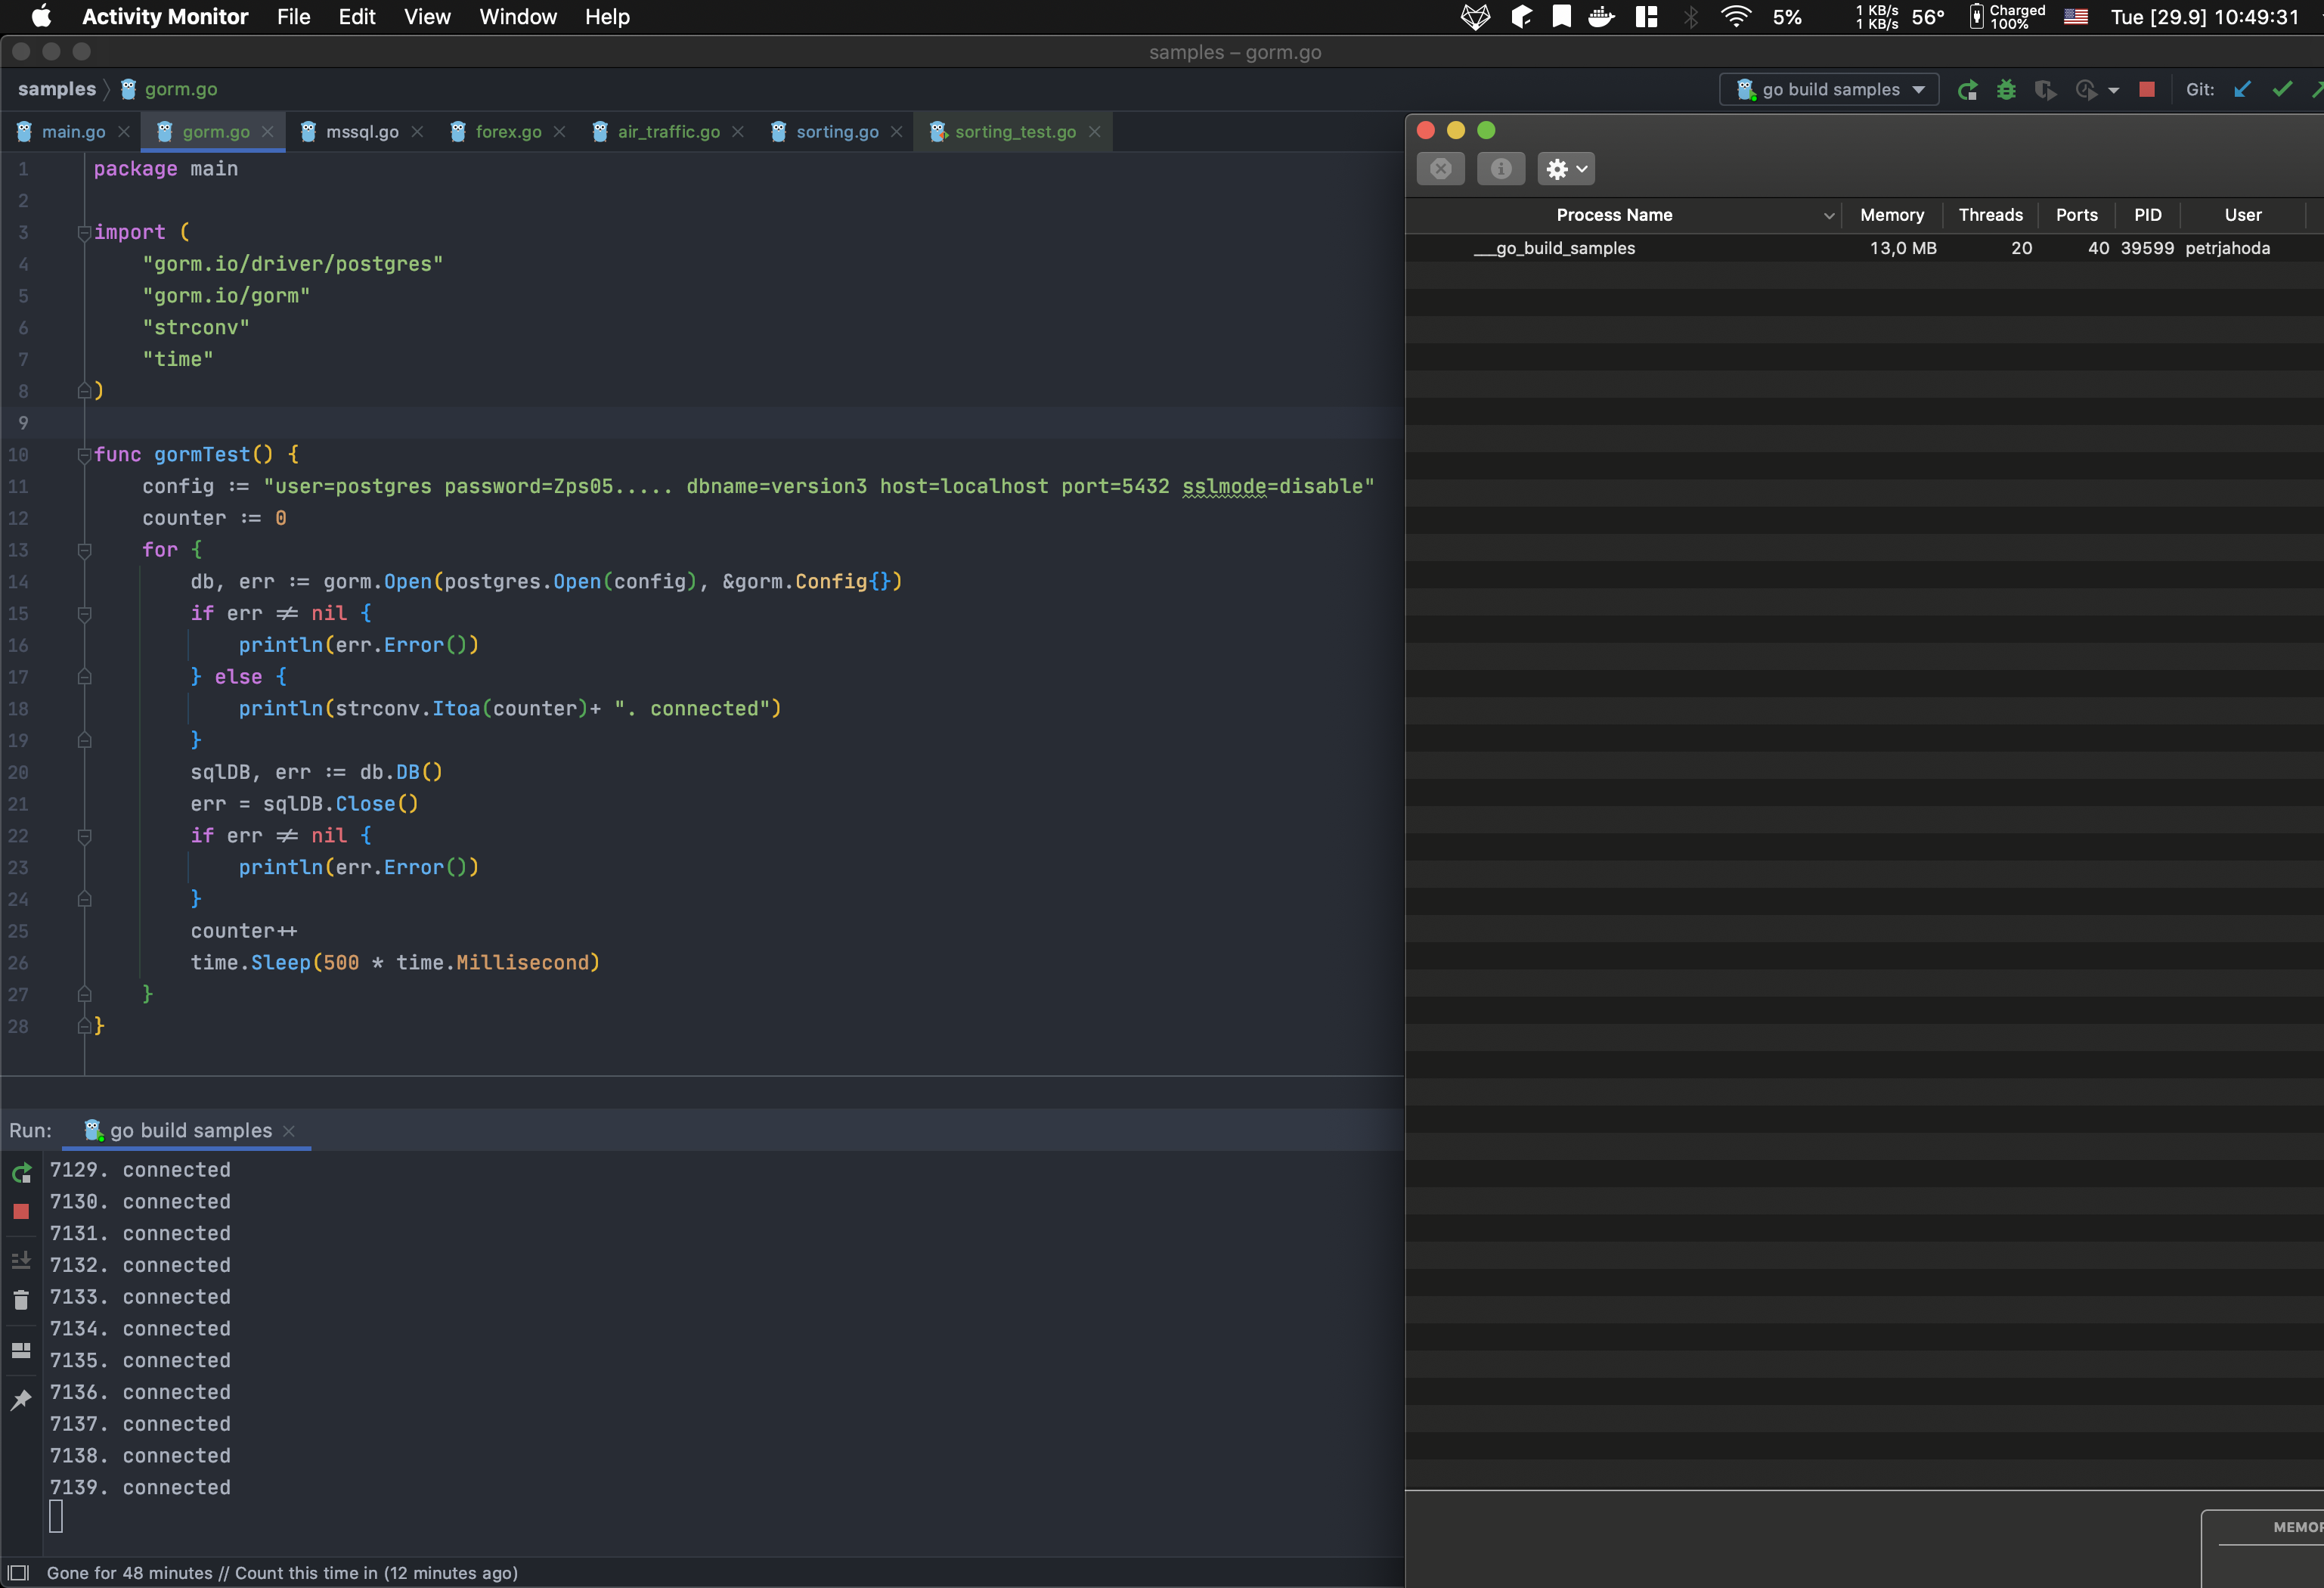
I am using Gorm a lot (v1, now v2), but I spot something, that attracted my attention. My services are very slowly, but steadily, consuming more and more memory. I dig deeper and removed code one thing after another. At the end I was left just with one function, that repeatedly downloads data from database. So after that I minimize that function to not download anything, just open and close the connection. Then I made a simple program, that only opens the connection and closes. See attached gif that show this behavior and two screenshots that show the memory increase after a while. The memory is increasing not constantly, looks like at logarithmic scale, but is increasing still.
Maybe I am doing something wrong, but I did not found anything wrong with the code. And yes, I need to open and closes connections as I need. I cannot opens - in my real program - one connection at the beginning and then reuse it everywhere.
Comment From: github-actions[bot]
The issue has been automatically marked as stale as it missing playground pull request link, which is important to help others understand your issue effectively and make sure the issue hasn't been fixed on latest master, checkout https://github.com/go-gorm/playground for details. it will be closed in 2 days if no further activity occurs. if you are asking question, please use the Question template, most likely your question already answered https://github.com/go-gorm/gorm/issues or described in the document https://gorm.io ✨ Search Before Asking ✨
Comment From: jinzhu
Hello,
I have tested it pprof and used GODEBUG=gctrace=1 to test the program, seems no leak happened, so this should not a GORM issue.
Thank you.
Comment From: jinzhu
also tested with sqlDB, err := sql.Open("mysql", dbDSN), got same issue, seems like golang doesn't release the memory to OS or the OS just haven't take the memory from the go application yet.
Comment From: petrjahoda
meanwhile I found out that, when manually calling garbage collector with runtime.GC() before the end of the loop, the memory DOES NOT increases that fast. It increases still... looks like... but at a very very very low speed.
I tested it for about 5 hours and it looks like it hit the limit above which it does not increase. Maybe I let it run for a weekend to confirm this. But from this observation, the "problem" may be with garbage collector, maybe not collecting properly those database connections, or maybe collecting them at somewhat slow or strange speed (collecting them at slower rate that new are made - but that does not make sense to me).
Also I made a different test: as I am using postgres, I tested this postgres driver: https://github.com/jackc/pgx. Similar results. And also this library: github.com/lib/pq gave me similar results.
So this is obviously not the case of gorm, but something different.
Do you think I should raise an issue directly to go?
Comment From: SbstnErhrdt
I have the same issue @petrjahoda also using postgres.
It takes about 8GBs of RAM in my case ...
I will try runtime.GC().
Comment From: pablodz
same error here, looks like driver is doing something wrong, after 100k calls, the process was taking around 1GB of RAM and didn't release memory
Comment From: pablodz
@SbstnErhrdt https://github.com/jackc/pgx/issues/845#issuecomment-1050465698