go.mod: gorm.io/driver/mysql v1.3.0 gorm.io/gorm v1.23.0 gorm.io/plugin/soft_delete v1.1.0
有啥方法可以查看单次查询各阶段的时间消耗?
Comment From: github-actions[bot]
The issue has been automatically marked as stale as it missing playground pull request link, which is important to help others understand your issue effectively and make sure the issue hasn't been fixed on latest master, checkout https://github.com/go-gorm/playground for details. it will be closed in 30 days if no further activity occurs. if you are asking question, please use the Question template, most likely your question already answered https://github.com/go-gorm/gorm/issues or described in the document https://gorm.io ✨ Search Before Asking ✨
Comment From: AnkoGo123
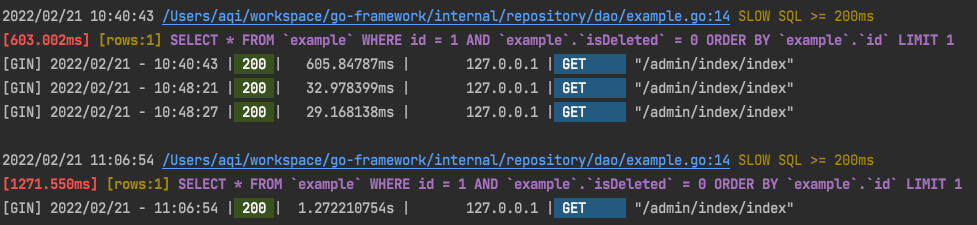
我也发觉查询特别慢,有时候,但是又不知道啥时候,总之有些查询需要600ms以上,而且sql语句还是特别简单常规的语句
Comment From: github-actions[bot]
The issue has been automatically marked as stale as it missing playground pull request link, which is important to help others understand your issue effectively and make sure the issue hasn't been fixed on latest master, checkout https://github.com/go-gorm/playground for details. it will be closed in 30 days if no further activity occurs. if you are asking question, please use the Question template, most likely your question already answered https://github.com/go-gorm/gorm/issues or described in the document https://gorm.io ✨ Search Before Asking ✨
Comment From: li-jin-gou
hello @doufujushi
- 目前 gorm 支持 opentracing 可以查询 SQL 耗时,但是做不到 DB 层面的各阶段耗时监控. https://github.com/go-gorm/opentracing
- 可以考虑一下否是可以开启 缓存SQL 预编译语句来优化查询性能. https://gorm.io/zh_CN/docs/performance.html#%E7%BC%93%E5%AD%98%E9%A2%84%E7%BC%96%E8%AF%91%E8%AF%AD%E5%8F%A5
- 之前还遇到过一种场景是 链接池设置过小 导致的看起来执行SQL很慢,在没有空闲链接的情况下,goroutine 会 hang 在获取 conn 的地方。
Comment From: github-actions[bot]
The issue has been automatically marked as stale as it missing playground pull request link, which is important to help others understand your issue effectively and make sure the issue hasn't been fixed on latest master, checkout https://github.com/go-gorm/playground for details. it will be closed in 30 days if no further activity occurs. if you are asking question, please use the Question template, most likely your question already answered https://github.com/go-gorm/gorm/issues or described in the document https://gorm.io ✨ Search Before Asking ✨
Comment From: AnkoGo123
你上面说的所有东西我都用过了 ,还是会出现每隔几次相同的sql语句就会出现一次大于300ms的sql语句执行时间,其他时间都是小于30ms,这个差距真的太大了,而且这几次的操作都是在30s内完成的,按照道理来说并未触发go的垃圾回收机制,不知道mysql是不是有这个弊端?
Comment From: github-actions[bot]
The issue has been automatically marked as stale as it missing playground pull request link, which is important to help others understand your issue effectively and make sure the issue hasn't been fixed on latest master, checkout https://github.com/go-gorm/playground for details. it will be closed in 30 days if no further activity occurs. if you are asking question, please use the Question template, most likely your question already answered https://github.com/go-gorm/gorm/issues or described in the document https://gorm.io ✨ Search Before Asking ✨
Comment From: jinzhu
应该就是数据库的问题,第一次查询慢,以后快,因为第一次数据库没有缓存,后面有 query cache, 和gorm 没啥关系应该
Comment From: DouFuJuShi
应该就是数据库的问题,第一次查询慢,以后快,因为第一次数据库没有缓存,后面有 query cache, 和gorm 没啥关系应该
测试库中同一主键值查询表example的数据,首次查询后数据肯定已经在内存当中;GORM打印出SLOW SQL的次数存在不确定性!

Comment From: jinzhu
截图上红色方框内的时间具体包含了哪些阶段的消耗总计?
SQL time + network time + Go time
Comment From: AnkoGo123
应该就是数据库的问题,第一次查询慢,以后快,因为第一次数据库没有缓存,后面有 query cache, 和gorm 没啥关系应该
并不是第一次查询,我执行同一条sql语句很多次了还是会出现大于300ms的时间
Comment From: areyacloud
应该就是数据库的问题,第一次查询慢,以后快,因为第一次数据库没有缓存,后面有 query cache, 和gorm 没啥关系应该
并不是第一次查询,我执行同一条sql语句很多次了还是会出现大于300ms的时间
请问解决了吗,我也发现这个问题了,mysql5.7,在链接很少,数据量很少,开启缓存预编译的情况下,简单的主键查询,首次耗时可以达到500ms,隔一段时间就出现一次。我将First查询方式改成Limit+Find后,这个情况就好多了。不知道有没有更好的方式
Comment From: van-scott
应该就是数据库的问题,第一次查询慢,以后快,因为第一次数据库没有缓存,后面有 query cache, 和gorm 没啥关系应该
并不是第一次查询,我执行同一条sql语句很多次了还是会出现大于300ms的时间
请问您是怎么解决的,我也遇见类似的情况,和数据库缓存没关系,有缓存和没缓存的差距没这么大
Comment From: li-jin-gou
应该就是数据库的问题,第一次查询慢,以后快,因为第一次数据库没有缓存,后面有 query cache, 和gorm 没啥关系应该
并不是第一次查询,我执行同一条sql语句很多次了还是会出现大于300ms的时间
请问您是怎么解决的,我也遇见类似的情况,和数据库缓存没关系,有缓存和没缓存的差距没这么大
在 mysql server 侧加一些监控分析看看