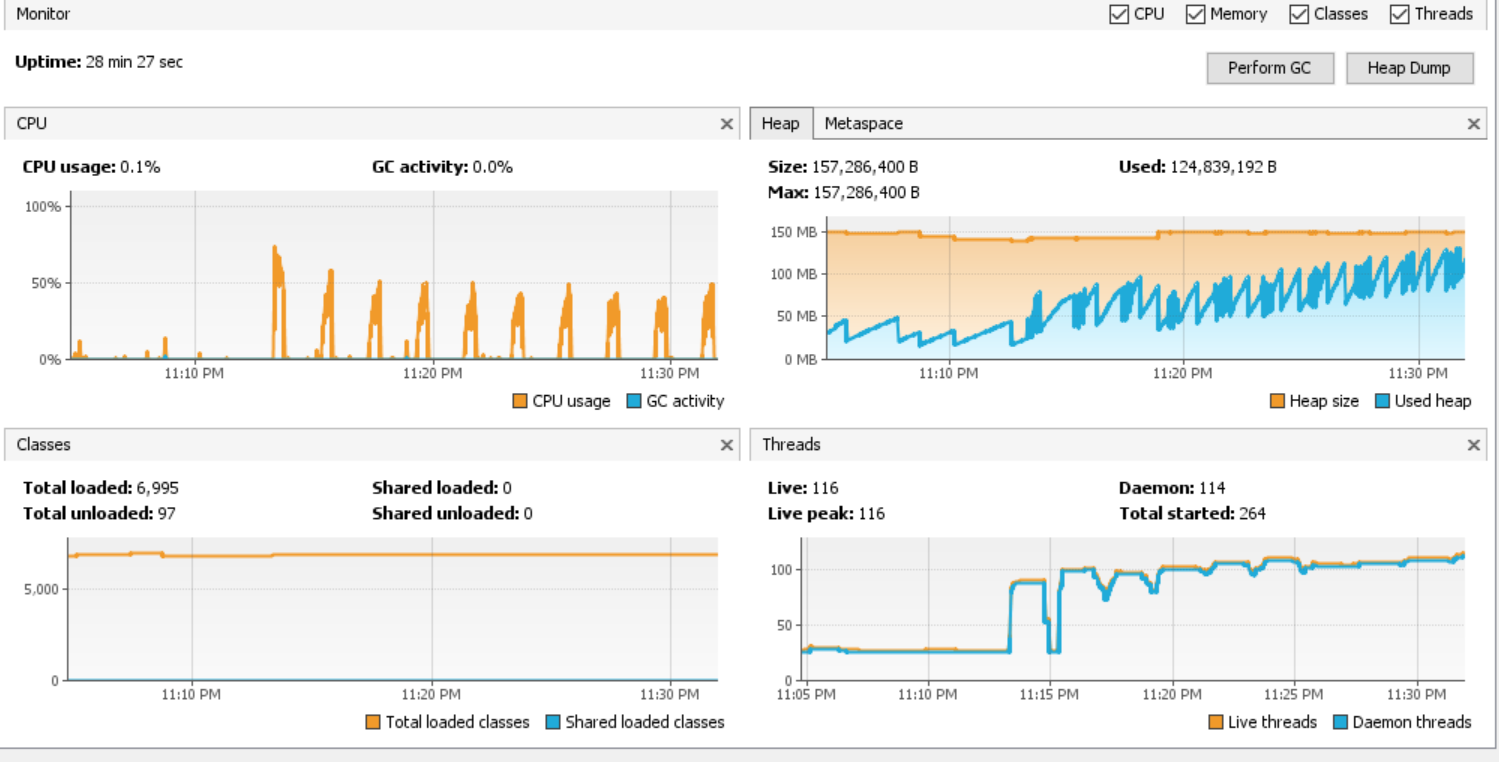
We have created one microservice with single endpoint. This api consist of single path variable and it is just returning OK response. In real time, it will have different processing mechanism but for testing and POC purpose we have kept it simple. Now, When we generate load with jmeter for this particular api and pass in random path variable values using random variable in jmeter then we have observed that memory is constantly increasing over a period of time and objects are not getting GC.
spring boot version:- 2.3.1 RELEASE dependencies:- spring-boot-starter-web, spring-boot-starter-security, spring-boot-starter-actuator
Sample api:- /app/ping/{id} GET
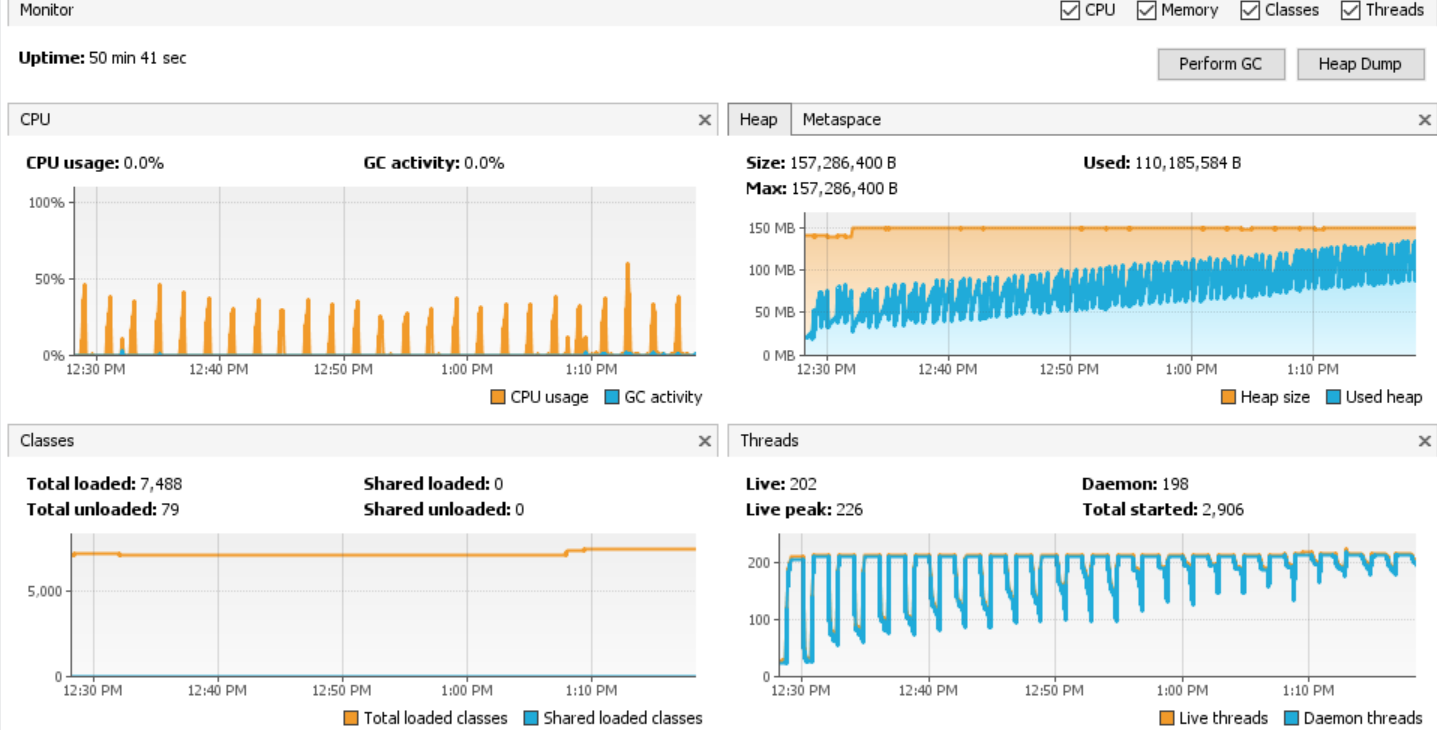
Jmeter :- path = /app/ping/${random_var} - random_var having value in between 1 - 100000 Number of Threads:- 60 Ramp Up Seconds:- 1 Loop Count:- Forever Spring boot app configuration:- -Xmx150m Heap Dump:- Attached VisvualVM screenshot:- Attached
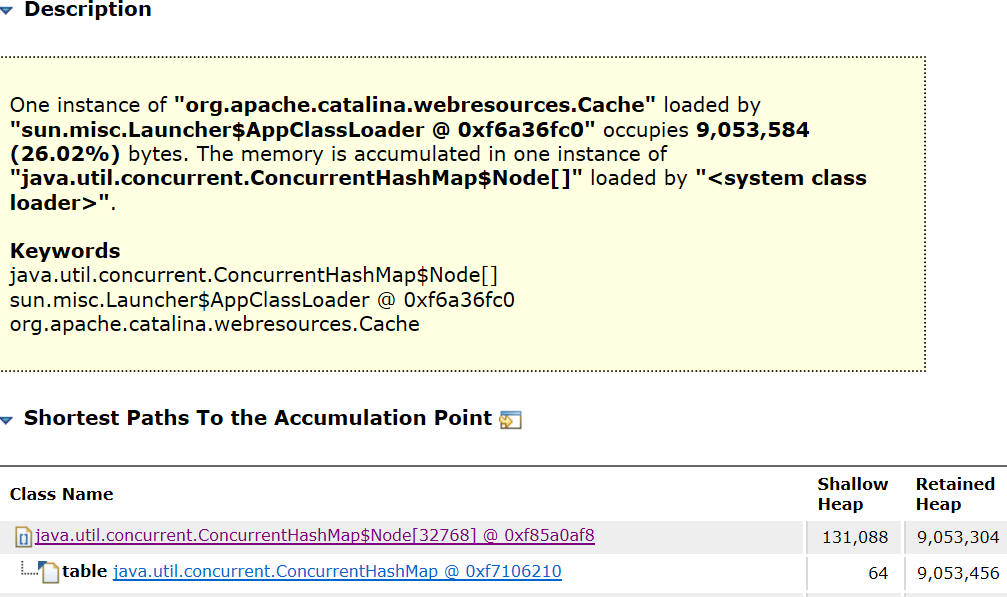
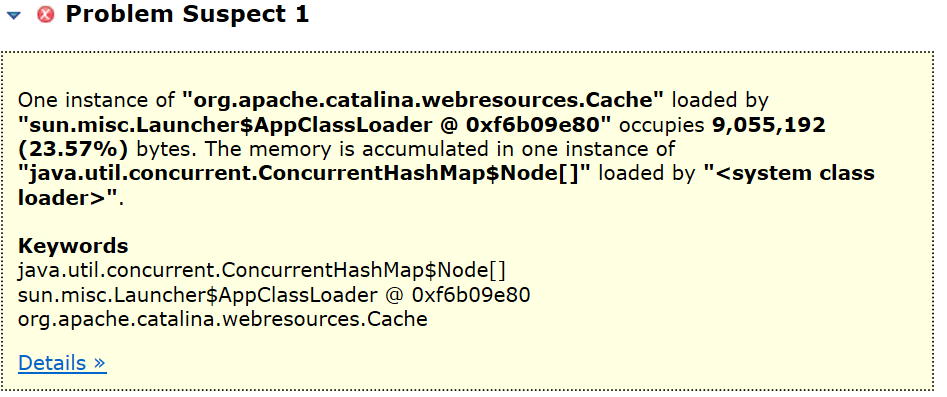
Leak Suspect: Attached
heapdump-1600192132939_Leak_Suspects.zip
Please let me know If I am missing something.
Comment From: bclozel
Could you share your sample application?
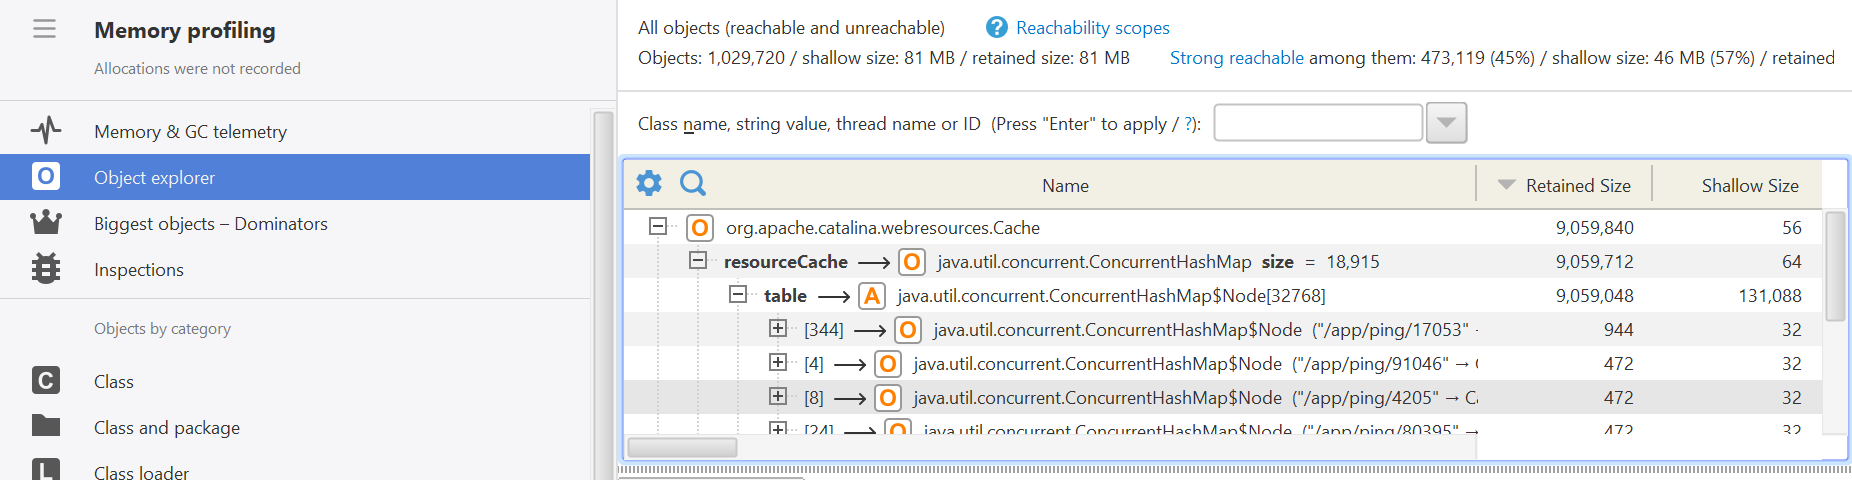
I'm seeing a lot of ConcurrentHashMap$Node instances held by Tomcat CachedResource entries.
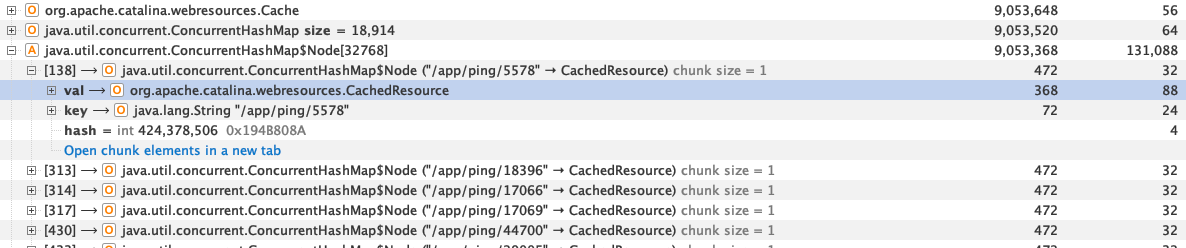
Requests to Spring endpoints should not create such cache entries - those are usually only linked to static resources served by Tomcat.
Comment From: rahulsingh336
attach below for reference:- 1.) sample application 2.) current heap dump 3.) memory leak - suspect zip 4.) visvual vm screen shot
demomemory.zip heapdump-1600197736545.zip heapdump-1600197736545_Leak_Suspects.zip
Comment From: bclozel
Are you sure this is the right application?
The application you've sent doesn't build because the POM is broken (it's importing spring-boot-starter-parent instead of spring-boot-parent) and it's also using 1.5.18.RELEASE, which is not maintained anymore.
I've fixed the POM and changed the version to 2.3.1 RELEASE (the version noted in your original report) and I can't reproduce the behavior here. I'm running a lot of requests on that endpoint, as explained in your report and yourkit doesn't show the cached entries in the object explorer as leak suspects.
Could you check again your sample app and make sure that you're running Yourkit against the actual sample and not some other deployed application?
Comment From: rahulsingh336
Sorry in original question version marked seems incorrect . Issue is on version "1.5.18.RELEASE". Please try with version "1.5.18.RELEASE". And what do you mean by POM is broken? The sample app was generated from "https://start.spring.io/" and version was changed. AFAIK spring-boot-starter-parent provides default configurations for our application and a complete dependency tree to quickly build our Spring Boot project. Please help me in understanding if I am missing some thing.
Comment From: rahulsingh336
attached your kit memory snapshot DemoApplication-2020-09-16.zip
Comment From: bclozel
Sorry about the spring-boot-starter-parent note, you're right.
Unfortunately 1.5.18.RELEASE is not maintained anymore, so I'm closing this issue - if you can reproduce this on a supported version we'd be happy to take a look. For what it's worth, those objects should not leak as they have a TTL associated with them and they should be collected by the GC.
Thanks!
Comment From: rahulsingh336
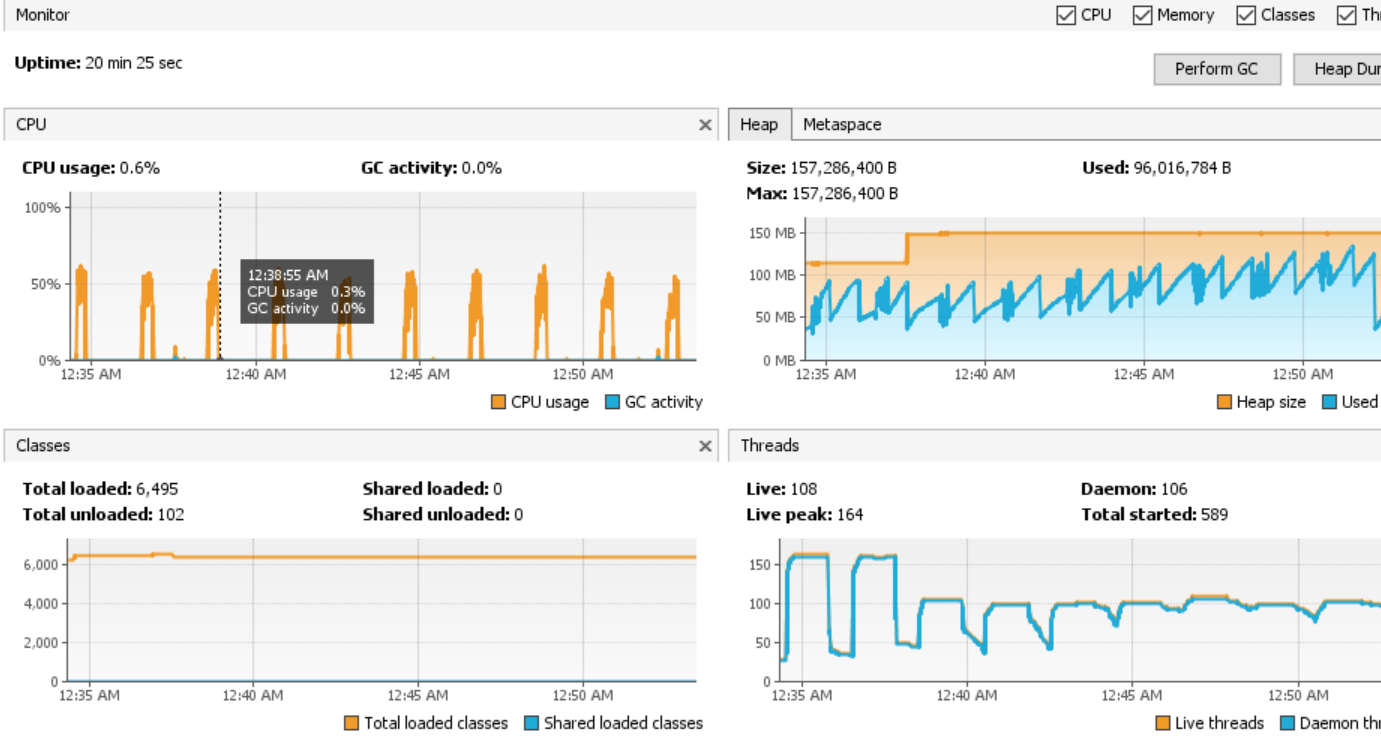
I have done test for spring boot 2.3.1 Release again and attached demo application. Memory grows in this case too but not in that much faced paced.
Attached :- 1.) Sample application with spring boot 2.3.1 release 2.) yourkit memory snapshot 3.) Visual VM screen shot 4.) Heap Dump Visual VM
demomemory_2.3_1.zip DemoApplication-Latest_yourKit_Memory.zip
Comment From: bclozel
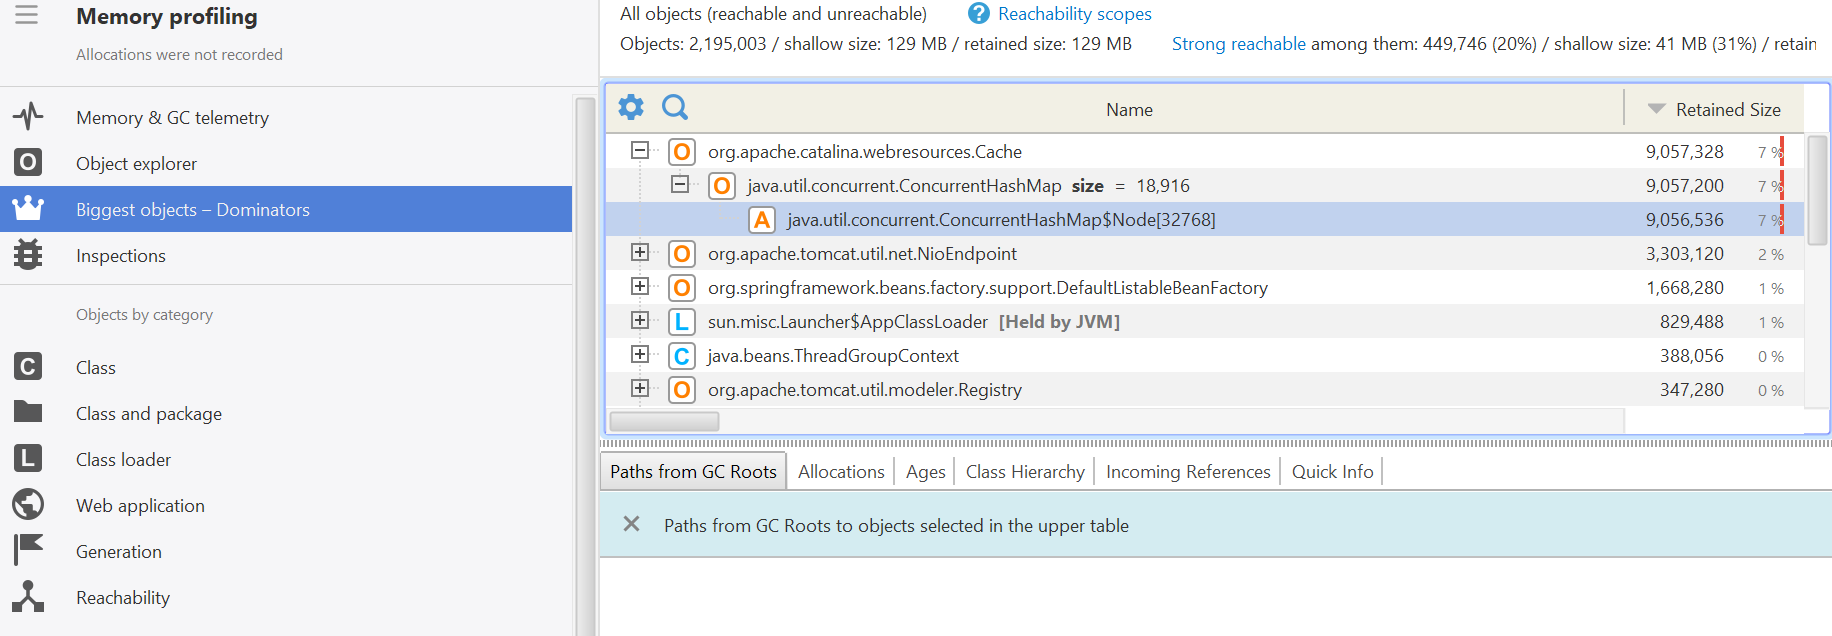
Unlike your previous report, I'm not seeing Tomcat CachedResource entries in the "biggest objects" tab, nor any evidence of memory leak. Could you elaborate on where the leak is in this case?
I ran a local benchmark as well and could not find any leak.
To make sure there's a memory leak, could you run your benchmark, then once it's done force a GC with the profiler and take a memory snapshot. If the heap looks fine and the snapshot doesn't show any problem, this just means that the application is creating short-lived objects and that they'll be collected by the GC. This is not a memory leak but standard JVM behavior given the memory it's been allocated.