As noted in #4727 at this point INFO risks to be monkey asses slow once there are too many clients. We need to better profile INFO, because it is a very abused command, called in all the contexts, repeatedly called by Redis Sentinel as well... Once identified all the slow spots, there is to find solutions, because sometimes those slow-to-compute information are also very useful for debugging. This issue is a note for me to do some design + implementation work to mitigate this problem before the release of Redis 5, and to get feedbacks about this problem.
Comment From: itamarhaber
10xby!
Comment From: soloestoy
good news, following
Comment From: kingpeterpaule
good news,following
Comment From: antirez
Please check the faster-info branch here for the initial work: https://github.com/antirez/redis/commits/faster-info
This removes the main slowdown due to parsing clients in an O(1) loop. What do you think?
Comment From: kingpeterpaule
Looks good to me. I'd like to point one thing: server.unixtime may not be continuous, for example now time we may get server.unixtime 10, but after a slow command we may get server.unixtime 12. So a more recent slot may be set to zero and still a history slot will be considered. But this is rare and make no harm, I think we should not worry about this.
Btw, in clientsCronTrackExpansiveClients, because server.unixtime is updated in serverCron and the local vars i ,j and ClientsPeakMemInput[j] ,ClientsPeakMemOutput[j] could be set outside clientsCronTrackExpansiveClients.
Comment From: soloestoy
server.unixtime may not be continuous
Agree.
So a more recent slot may be set to zero and still a history slot will be considered. But this is rare and make no harm, I think we should not worry about this.
I think that could break the recent semantics, imagine that:
Time 1: server.unixtime = 1, then we update ClientsPeakMemInput[1] and zero ClientsPeakMemInput[2]

Time 2: server.unixtime = 4, then we update ClientsPeakMemInput[4] and zero ClientsPeakMemInput[5]

Time 3: server.unixtime = 8, then we update ClientsPeakMemInput[0] and zero ClientsPeakMemInput[1]

Time 4: server.unixtime = 12, then we update ClientsPeakMemInput[4] and zero ClientsPeakMemInput[5]

Then we send command like `debug sleep 4` every loop... ClientsPeakMemInput[2] can not be updated ever.
But that rarely happens, server.unixtime is random in general.
Comment From: antirez
Hello @kingpeterpaule, thanks for the review, yes after any slow command (and other events) we see our index jumping more than one second and it is possible that the N samples are holding data which is older than N seconds. But as you said, this is not going to be a problem (and technically speaking there is even a fix... we could have the unix time in every sample to filter old samples, but looks too expensive for the problem at hand). However as I noticed this while writing the code, and now you are reporting this, I now have the feeling that this will be reported often in the future, so better to put a comment there!
I don't understand the following sentence:
Btw, in clientsCronTrackExpansiveClients, because server.unixtime is updated in serverCron and the local vars i ,j and ClientsPeakMemInput[j] ,ClientsPeakMemOutput[j] could be set outside clientsCronTrackExpansiveClients.
Are you just specifying how this happens? Thank you.
Comment From: antirez
I've a question for all you (and @oranagra) that manage big installations where often there are many connected clients. Did you ever notice clientCron() to be too slow processing num_clients/server.hz clients per loop, or do you just setup an higher server.hz value in order to avoid latency issues? Because with 10k clients and the default HZ value, we already got 1000 clients to process per call...
Comment From: soloestoy
Hi @antirez , I remember that in issue #4983 a user reported redis hang up because of clientsCronResizeQueryBuffer.
You fixed it in commit cec404f099e3a1a3ce6e94c01ce45d851bd3e843, but I still have some questions, see more details in the original issue, thanks.
Comment From: kingpeterpaule
Hi @antirez , could we modify
int clientsCronTrackExpansiveClients(client *c)
to
   int clientsCronTrackExpansiveClients(client *c, size i) and the second param is the index.


void clientsCron(void) {


    int i = server.unixtime % CLIENTS_PEAK_MEM_USAGE_SLOTS;
    int j = (i+1) % CLIENTS_PEAK_MEM_USAGE_SLOTS;

    /* Always zero the next sample, so that when we switch to that second, we'll
     * only register samples that are greater in that second without considering
     * the history of such slot. */
    ClientsPeakMemInput[j] = 0;
    ClientsPeakMemOutput[j] = 0;

    while(listLength(server.clients) && iterations--) {

    if (clientsCronHandleTimeout(c,now)) continue;
    if (clientsCronResizeQueryBuffer(c)) continue;
    if (clientsCronTrackExpansiveClients(c, i)) continue;
  }
}
After all, we don't need to set ClientsPeakMemInput and ClientsPeakMemOutput in clientsCronTrackExpansiveClients for every client. Just a suggestion.
At last I'am confused
if (clientsCronTrackExpansiveClients(c, i)) continue;
for the "if" and "continue", Could we remove them?
I have an idea. Can we use a counter to replace server.unixtime? We suppose that when serverCron run server.hz times, 1 second elapsed. So we let a counter to count the serverCron run times,
if counter % server.hz == 0
then 1 second, and we get a continuous timer, though it's not accurate too.
Could we add a latency event to monitor clientCron?
Comment From: oranagra
@antirez I didn't encounter cases that clientsCron causes latency, but maybe this is just because there's no measurement for latency monitor in that function or even at serverCron, so even if there were some unexplained latency issues in production, i wouldn't be able to track them to this function. maybe it would be a good idea to add latency monitor sample, at least in serverCron.
One more partially related note about clients and their memory consumption (which we already discussed in the past), please take a look at this PR https://github.com/antirez/redis/pull/5159 i wanted to submit long ago and didn't get a chance.
Comment From: antirez
Hello @kingpeterpaule, I don't think there is really any need to make the design more complex just to avoid the "skipping index" problem. There are two reasons for this, one is the goal of the feature. We should ask ourself when making a design complex if the additional complexity really fixes anything for us. In that case, that INFO field, is useful in order to understand if some client at some point is misbehaving and having like Pub/Sub active without processing messages, or a slave is blocked and the master is just accumulating writes to the output buffer. This condition happens for accumulation of writes over some time. To have the field of the max in/out buffers delayed a bit is not a problem, does not make the feature less useful, nor it really creates a false positive, we want to know if at some near point there was such a problem anyway. Moreover as @soloestoy noted, even if there are repeated delays + skip index conditions, this are going to be kinda random from the POV of the generated indexes. Given that we have just 8 indexes, every index will get zeroed at some point. Anyway, if we really wanted to fix that, the right solution is to tag every index with the last time it was zeroed. This way we can easily filter the unreliable results in a more consistent way.
@oranagra about adding a probe in clientsCron(), yep, we could do that, even if it is hard to interpret for the user if there is a delay there. What is strange about proving clientsCron() for latency is that we fully control it, there are no unexpected latencies there. So what about fixing it instead so that it cannot iterate more than N times per cycle, and forget about it? I've an idea about it that I'm submitting to you today to see if it makes sense.
Comment From: oranagra
@antirez i suggested to add latency monitor to serverCron (not necessarily to clientsCron).
Comment From: antirez
@oranagra, @soloestoy, @kingpeterpaule and the other friends here, this is the idea: https://github.com/antirez/redis/compare/dynamic-hz
Background is that an higher HZ by default is an energy hog, for some kernel related reason to awake Redis from the sleep because of select() (or similar) timeout is a lot of CPU time, so an HZ of 100 already brings the CPU usage on small instances to a few percentage points...
However when we have many clients, we want serverCron() and the functions nested there to be called more often. So here is an adaptive solution that should be optimal unless I'm missing something and it is unsafe for some reasons to change HZ dynamically.
Comment From: antirez
I merged the dynamic hz patch, it is now enabled by default.
Comment From: igorwwwwwwwwwwwwwwwwwwww
Info performance is still (or possibly again) an issue, specifically when there are many clients connected.
For one of our production clusters (redis 5.0.7), the average latency is > 1ms. From a recent cpu profile, this accounted for >1% of all sampled stacks.
Here is the breakdown (via flamescope):
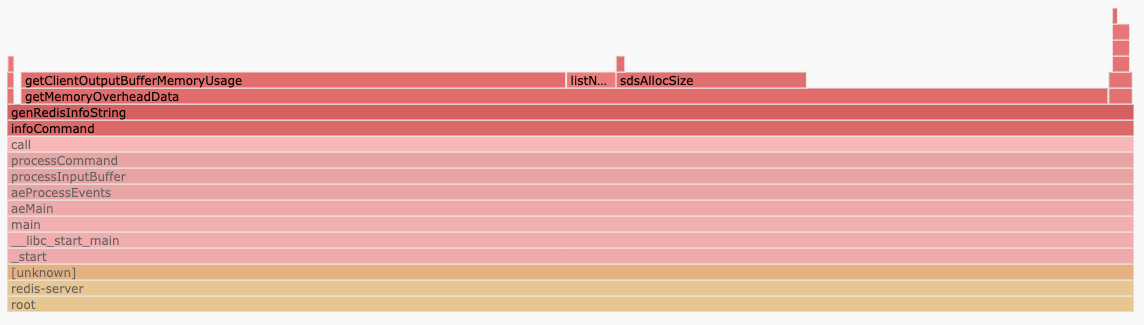
Almost all of the time is spent in getMemoryOverheadData, specifically calling getClientOutputBufferMemoryUsage. The code for computing clients_normal performs a linear scan over all connected clients, in our case ~5k.
Maintaining a separate variable for the sum of client buffers would likely fix this. If that is too expensive, it may be worth caching the value, and perhaps showing the uncached value as part of info memory only.
Comment From: antirez
@igorwwwwwwwwwwwwwwwwwwww I propose f6987628, what do you think? Also I would love @oranagra to validate this approach from his point of view as well. Please check the commit message for the why it is using a peculiar approach.
Comment From: igorwwwwwwwwwwwwwwwwwwww
@antirez Looks good, thanks!
Comment From: antirez
Good! Merged into Redis unstable. Will be part of the next Redis 6 release candidate.
Comment From: trevor211
following
Comment From: oranagra
as far as i can tell all of the concerns here are already handled by f69876280c630d49574fa094808d3a4791c5039b. i'm closing it, let me know if you think otherwise.