We (@gitlab) saw very high CPU utilization on our redis instance used for sidekiq (running redis 5.0.7).
A CPU profile revealed a lot of time being spent in unblockClientWaitingData, specifically in listSearchKey.
You can see it here:
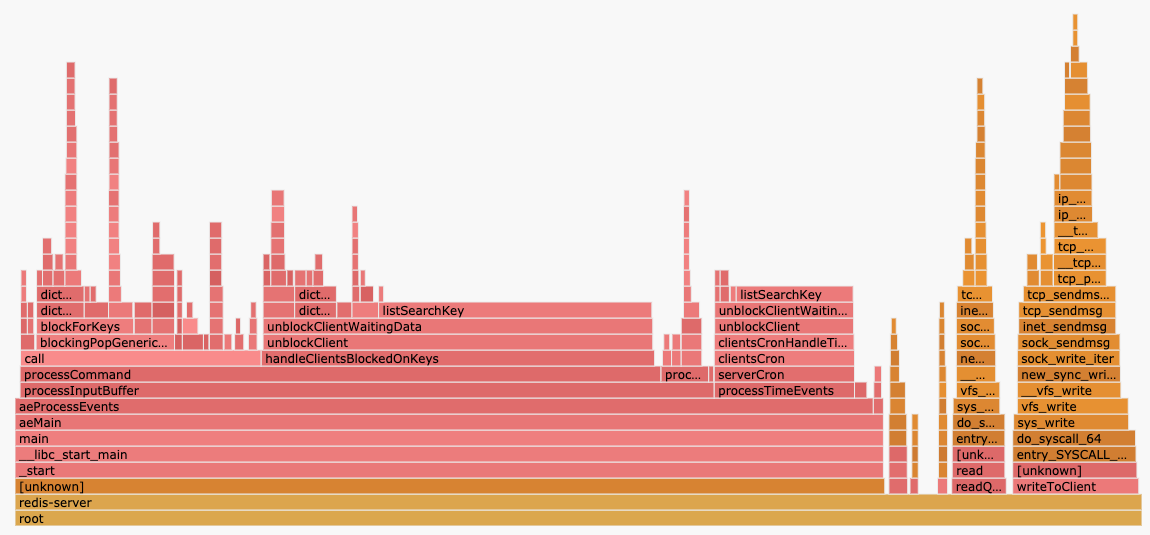
The two main call sites are processCommand and clientsCron.
The main issue appears to be the linear scan through the list of clients blocked on the same key. One possible approach might be changing c->db->blocking_keys[key] to a dict.
Comment From: antirez
@igorwwwwwwwwwwwwwwwwwwww I think the fix is very simple. If I fix it ASAP, are you able to test my modification in order to validate it works? We may add it to Redis 6. Moreover the fix will be simple enough to be trivial to port to Redis 5.
Comment From: igorwwwwwwwwwwwwwwwwwwww
@antirez Great! I'd be happy to test the fix. A backport to Redis 5 would be excellent.
Comment From: antirez
@igorwwwwwwwwwwwwwwwwwwww I just pushed a fix in the o1-bpop branch. The commit is referenced here. This should solve the problem (it was not hard but I had to deal with a few low level details, so there is some code in adlist.c as well). Pinging @oranagra @soloestoy @madolson @yossigo
and others. It looks like a very important speedup, all tests passing, I would merge into Redis 6.
Comment From: igorwwwwwwwwwwwwwwwwwwww
One note: The flamegraph I showed is from when the clients are also listening on a large amount of keys. We managed to improve things a little bit by reducing the number of keys. There is less pressure on clientsCron, but it's still significant.
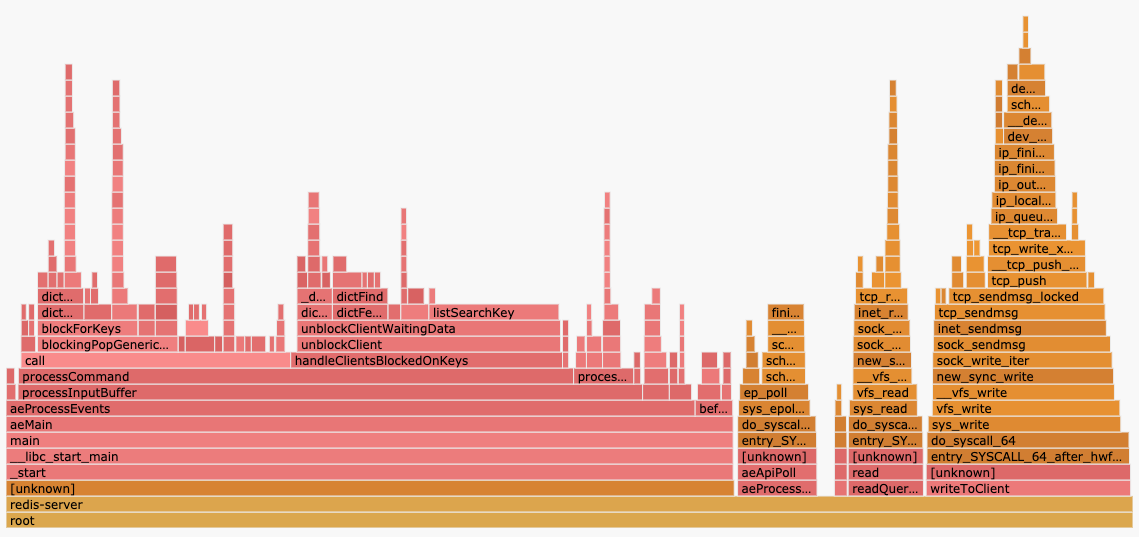
We're still spending 24% of time in handleClientsBlockedOnKeys, 11% of all time in listSearchKey.
Comment From: antirez
@igorwwwwwwwwwwwwwwwwwwww the 11% of listSearchKey should be completely gone now after you apply such commit.
Comment From: antirez
However @igorwwwwwwwwwwwwwwwwwwww (lol this username is fantastic) note that this commit is not yet backported to Redis 5. Do you still are able to test it or you want me to attempt a quick backport?
Comment From: igorwwwwwwwwwwwwwwwwwwww
Synthetic tests look promising, working on testing it with real traffic now.
Comment From: oranagra
code looks good to me.
Comment From: antirez
@igorwwwwwwwwwwwwwwwwwwww thanks, your profiling activities are of great interest for me and I also think that @oranagra is appreciating it as well.
Comment From: soloestoy
Looks good to me, and this commit reminds me of optimizing unlinkClient, I think there are still many scenarios like this we can reduce from O(n) to O(1).
Comment From: antirez
Exactly @soloestoy... we should definitely do this more. After all it is as simple as grepping for listSearch maybe?
Comment From: soloestoy
Grep is an effective way : ) , moreover maybe we can replace list with dict?
Comment From: antirez
@soloestoy when we can use the list and take the reference, lists are much faster, so maybe if we really don't need to perform a "lookup" operation, we should stick with lists.
Comment From: igorwwwwwwwwwwwwwwwwwwww
@antirez Reproducing production traffic is proving difficult, but if we can get a Redis 5 backport, I should be able to test in our staging env. It's busy enough that the effect should be measurable there as well.
Comment From: antirez
@antirez Reproducing production traffic is proving difficult, but if we can get a Redis 5 backport, I should be able to test in our staging env. It's busy enough that the effect should be measurable there as well.
Backporting is not a big effort. Tomorrow I'll send you the same branch but based on Redis 5.
Comment From: antirez
@igorwwwwwwwwwwwwwwwwwwww ok just ported it here in the branch o1-bpop-5.0.
Comment From: igorwwwwwwwwwwwwwwwwwwww
@antirez I managed to test this in staging today. We can already see the improvement there!
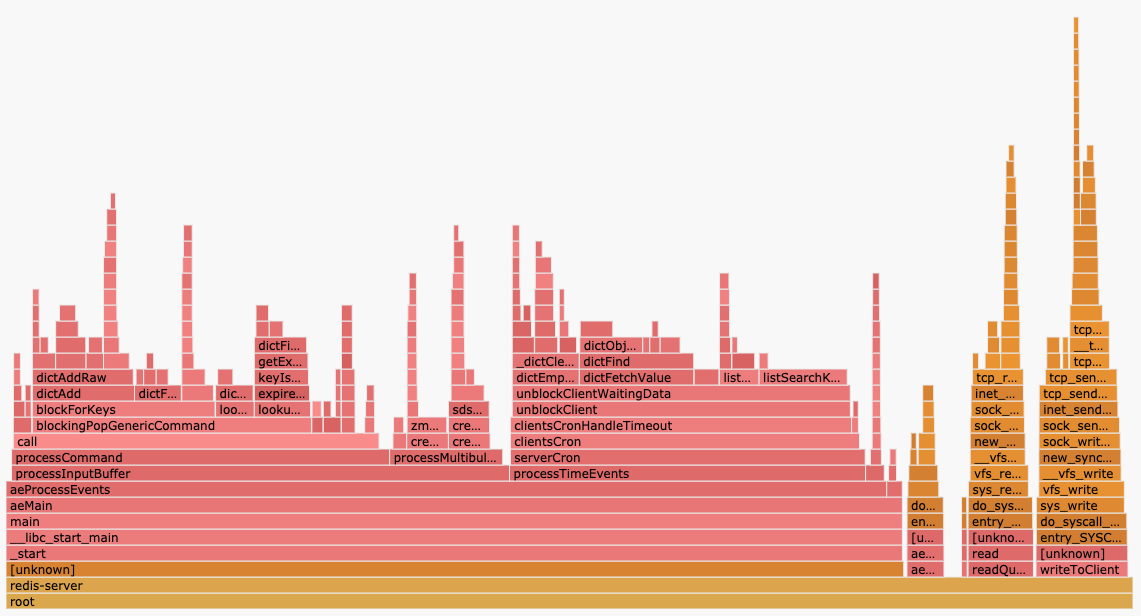
Before:
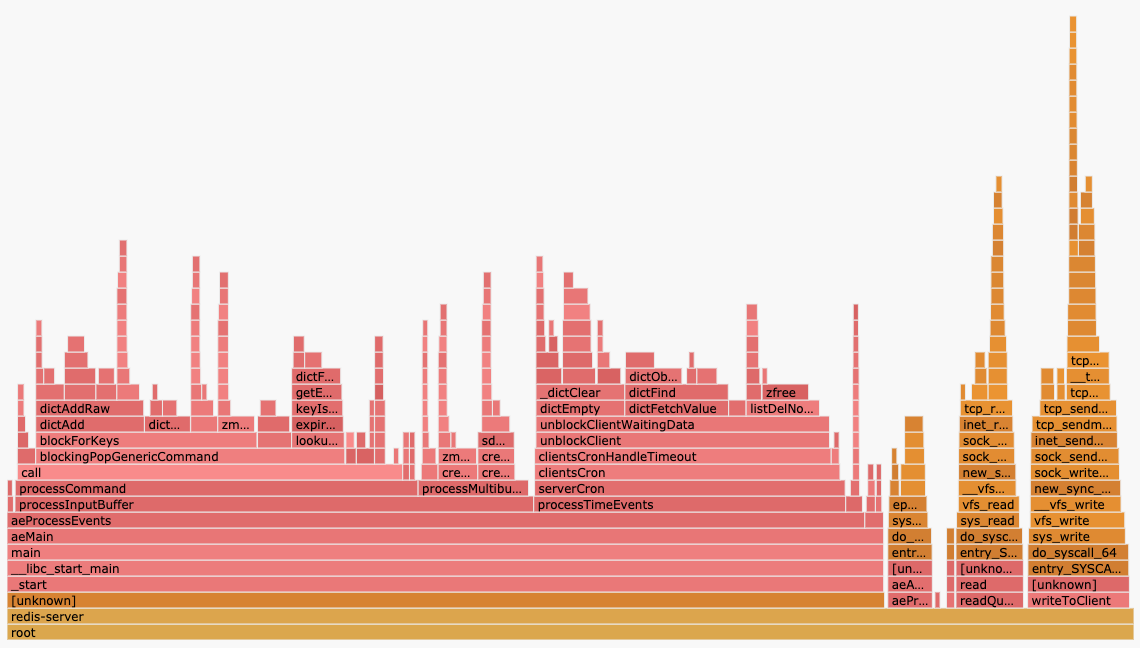
After:
Zooming in on clientsCron.
Before:
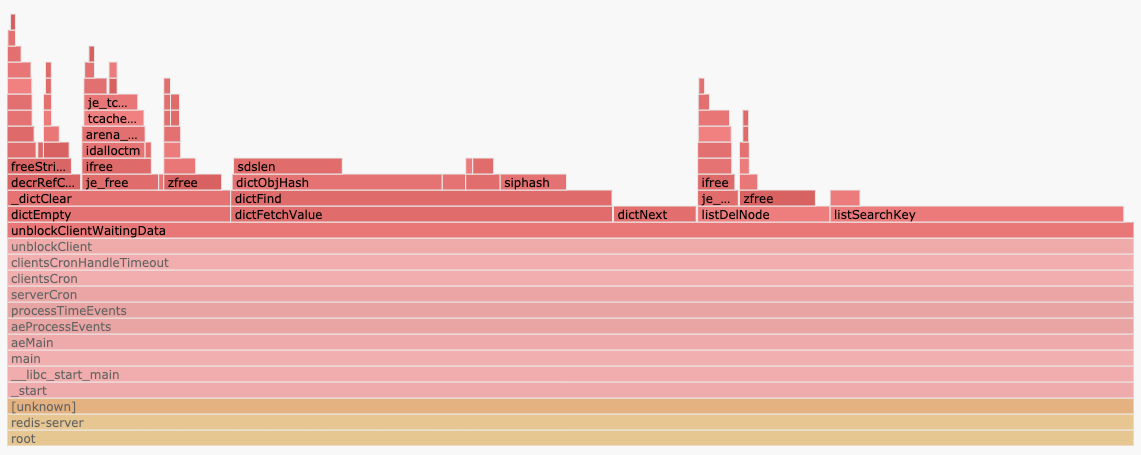
After:
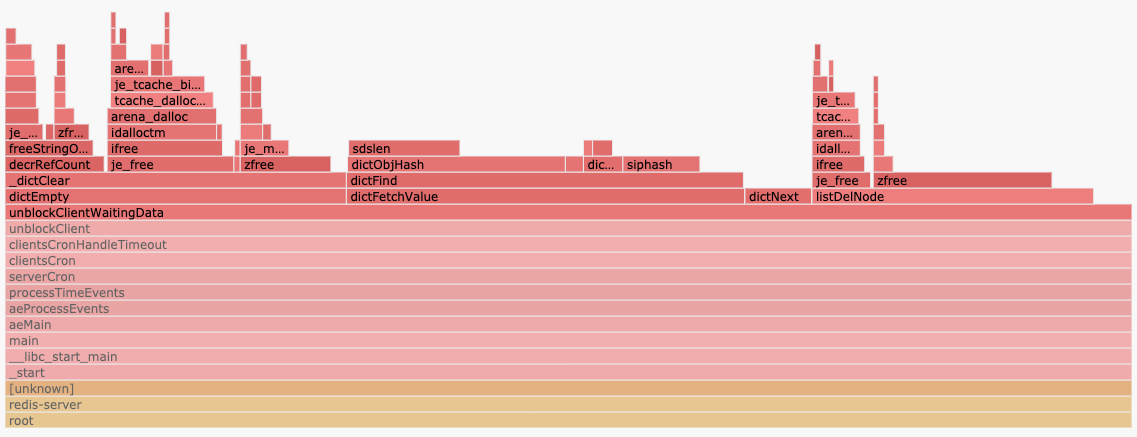
Measured over a 5 minute window, average CPU utilization dropped from 9.24% to 8.24%. I'd say this already confirms that the fix is working.
Note that this was on our staging cluster which is less loaded and has a different traffic pattern to production. I expect the effect to be much more dramatic in production, as we also have more connected clients there. We'll probably have to wait for a tagged release to roll it out -- but I'd be happy to report back here with more numbers and profiles once it's out.
FYI, this is from https://gitlab.com. :)
Also, in case anyone is wondering how to get these profiles, these are the commands I used to record them (via perf):
sudo perf record -p $(pidof redis-server) -F 497 --call-graph dwarf --no-inherit -- sleep 300
sudo perf script --header | gzip > stacks.gz
Visualization and analysis was done via flamescope, though you can also use @brendangregg's flamegraph.
Comment From: antirez
@igorwwwwwwwwwwwwwwwwwwww great! I just merged the patch to Redis unstable, and will be part of Redis 6. Not sure about what to do with the 5.0 branch but given that you are running it in production without issues and all the tests are passing, I'm tempted. Ping @oranagra and @yossigo to know if they agree we merge into 5.0 as well, I'm positive about it.
Also many thanks for providing ready to use infos to generate the flame graph :-) Very useful. Happy to know Gitlab is still using Redis!
Comment From: guybe7
@antirez IMHO we should backport. great improvement btw, clean code and O(1)
Comment From: oranagra
@antirez i agree, don't see any big risk.
Comment From: antirez
Thank you, backported.
Comment From: igorwwwwwwwwwwwwwwwwwwww
We finally got around to rolling this out, and I wanted to share the results here!
This profile was taken on redis 5.0.7 (before the fix). listSearchKey is taking up 9.5% of the profile (highlighted in magenta):
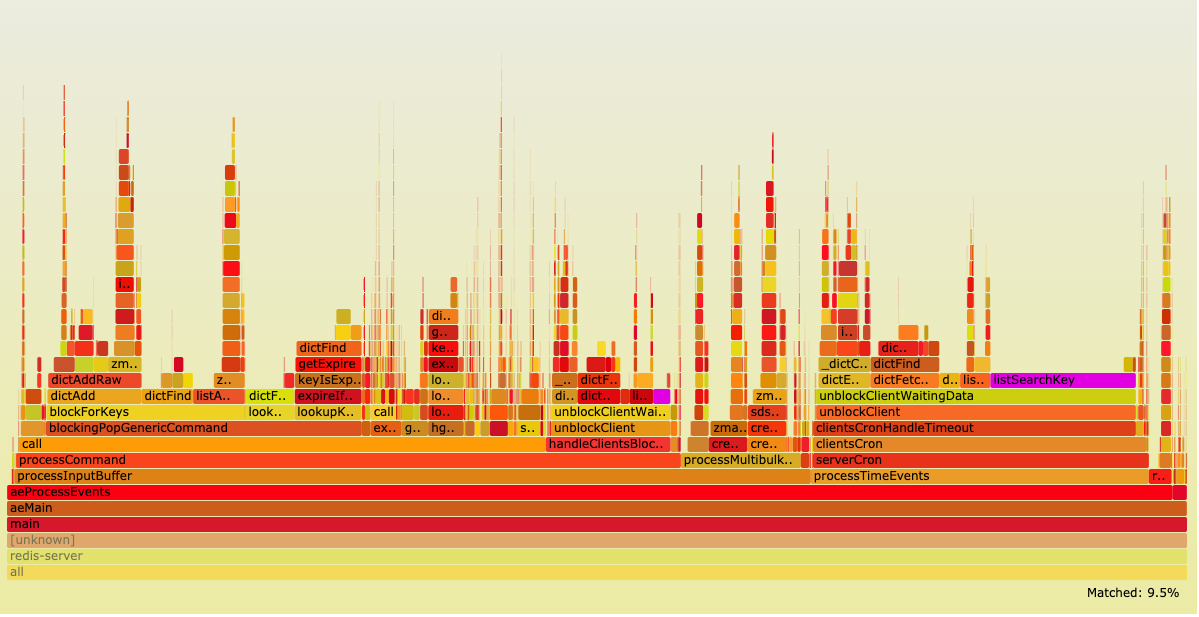
redis-sidekiq-01-db-gprd.20200818T002237.svg.gz
And after we upgraded to 5.0.9, listSearchKey no longer shows up in the profile at all!
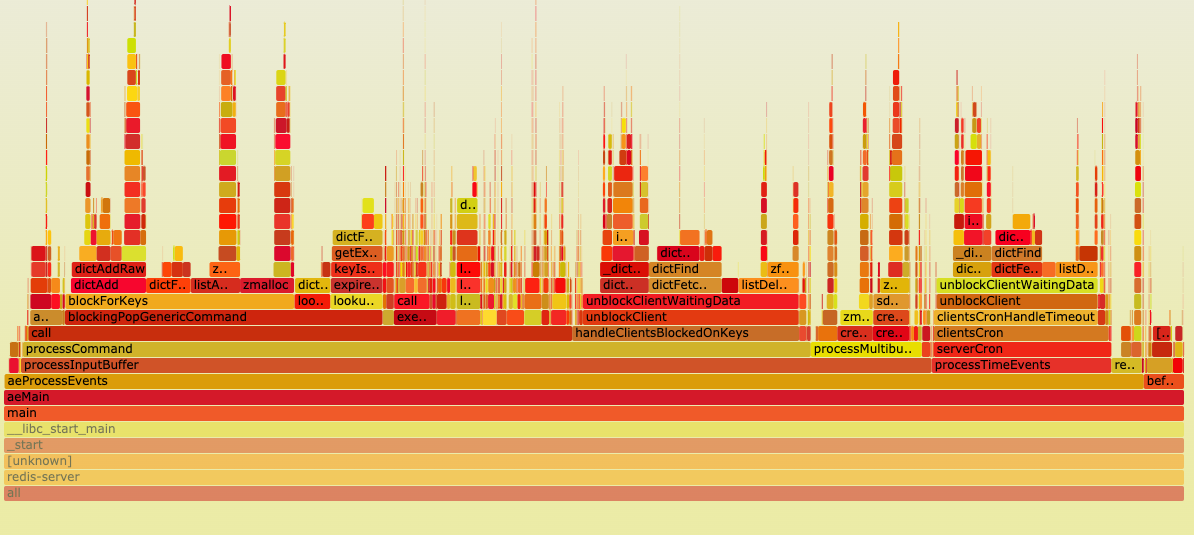
redis-sidekiq-03-db-gprd.20200820T092237.svg.gz
Thanks again for this wonderful fix, @antirez and @oranagra.