You helped us enormously with fixing a few previous performance regressions (such as https://github.com/redis/redis/issues/7071), and today we (@GitLab) wanted to share another finding that might potentially yield a big performance win.
This looks to us like a significant performance regression that was introduced by adding modules support, and we wanted to get your take on it.
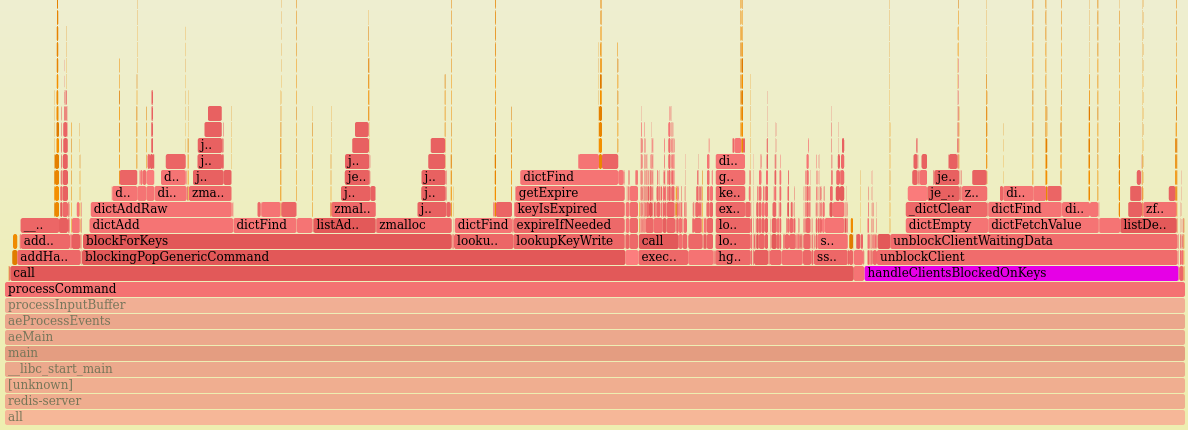
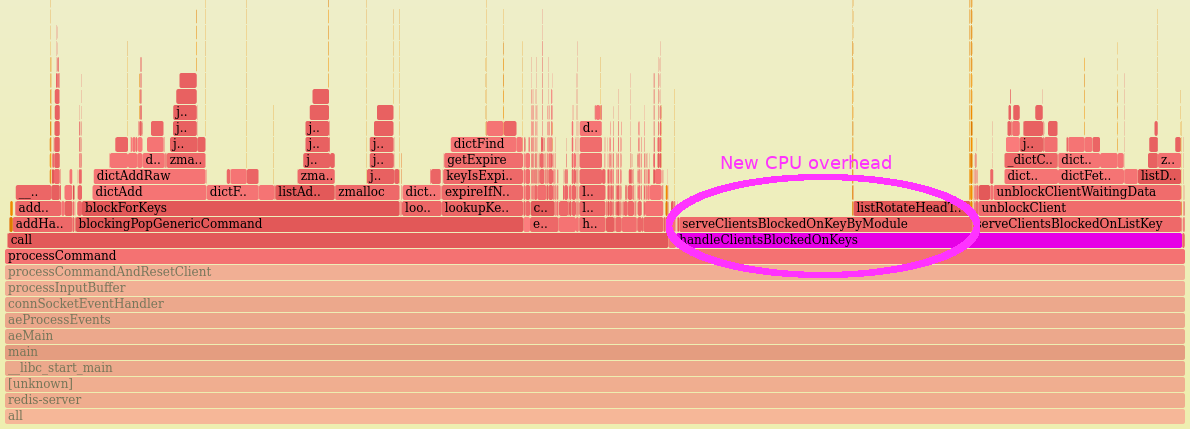
When upgrading from Redis 5.0.9 to 6.0.10 on an instance where many clients run BRPOP, we found the redis-server main thread's CPU cost roughly doubled for handleClientsBlockedOnKeys. The extra CPU time is spent in serveClientsBlockedOnKeyByModule. This is on a vanilla instance that is not using any modules, which seems like it should be the cheapest possible case.
Would it make sense to short-circuit out of that code path for the case where no modules are registered (since that seems like an important and presumably common use-case)?
For context, we saw a 15% increase in overall CPU usage by the main redis-server thread when upgrading from Redis 5.0.9 to 6.0.10. This Redis instance's workload is primarily serving high throughput job queues, where many clients frequently call BRPOP. The following pair of CPU profiles compare the same production workload and dataset immediately before versus after the version change.
The highlight here is that:
* On Redis 5.0.9, handleClientsBlockedOnKeys spent 95% of its time calling unblockClient (good).
* On Redis 6.0.10, handleClientsBlockedOnKeys spent the same amount of time in unblockClient, but it also calls serveClientsBlockedOnKeyByModule -- and that call adds a lot of overhead: 15% of the main thread's CPU time is spent there.
* In both cases, unblockClient represents the same amount of CPU time (roughly 11%), so its cost did not regress. The new CPU burn is coming from serveClientsBlockedOnKeyByModule, which in this case looks like pure overhead.
CPU profile for Redis 5.0.9:
CPU profile for Redis 6.0.10:
For convenience, here is the call site in Redis 6.0.10:
https://github.com/redis/redis/blob/6.0.10/src/blocked.c#L516
474 void handleClientsBlockedOnKeys(void) {
475     while(listLength(server.ready_keys) != 0) {
476         list *l;
...
485         while(listLength(l) != 0) {
486             listNode *ln = listFirst(l);
487             readyList *rl = ln->value;
...
506             if (o != NULL) {
507                 if (o->type == OBJ_LIST)
508                     serveClientsBlockedOnListKey(o,rl);  /* Calls "unblockClient" */
...
516                 serveClientsBlockedOnKeyByModule(rl);  /* Expensive even with no modules registered */
517             }
Comment From: itamarhaber
Hello @matt-smiley - many thanks for reporting this and investing the effort in making such a detailed analysis.
Comment From: matt-smiley
Thank you for helping @itamarhaber!
Just in case it's useful, I meant to also include the full flamegraphs (in addition to the static images), in case you want to see more details in the call trees.
Comment From: igorwwwwwwwwwwwwwwwwwwww
I dug up the original context for this change. It looks like the serveClientsBlockedOnKeyByModule was introduced in https://github.com/redis/redis/pull/6490#issuecomment-548329053, by this commit in particular: https://github.com/redis/redis/commit/215b72c0ba1f42d15dcfe6fa60abb414275296ba.
Comment From: itamarhaber
Pinging @guybe7 for introspection
Comment From: guybe7
@matt-smiley are you guys using modules? i think we just just avoid calling serveClientsBlockedOnKeyByModule is not modules are loaded.. or even better - maintain a count of all clients that are module-blocked and see if it's != 0
Comment From: guybe7
@matt-smiley if i PR the above modification would you be able to benchmark it?
Comment From: itamarhaber
@guybe7 the OP noted:
This is on a vanilla instance that is not using any modules
Also, the fast exit path is an obvious improvement, but if I'm not mistaken the regression will still manifest when modules are used in that case. If so, should we look into optimizing serveClientsBlockedOnKeyByModule somehow as well?
Comment From: itamarhaber
/cc @filipecosta90 because of this being relevant to performance
Comment From: filipecosta90
@itamarhaber :+1: I believe it's extremely beneficial to assess why this happens with/without modules and if something can be done to improve it when modules are present also. If you guys agree I'll simulate this on my side ( with modules ) and share further data / potential low hanging fruits :)
Comment From: igorwwwwwwwwwwwwwwwwwwww
@guybe7 We're not using any modules at present. We should be able to test experimental patches, as long as they are backportable to 6.0.
I liked your suggestion of maintaining a count or flag for clients blocking on BLOCKED_MODULE -- that should eliminate the overhead even when modules are active -- except when a module is actively using blocking.
Comment From: matt-smiley
I believe it's extremely beneficial to assess why this happens with/without modules and if something can be done to improve it when modules are present also.
@filipecosta90 I completely agree with you. I think the crucial aspects of our workload that exposed this regression are that:
* Many client connections are concurrently running BRPOP on the same keys.
* When no modules are in use, serveClientsBlockedOnKeyByModule is doomed to walk the entire list of clients for every BRPOP command.
* This is why the profile shows serveClientsBlockedOnKeyByModule spending nearly half of its time calling listRotateHeadToTail on its list of blocking clients.
For reference, I did a little extra profiling of our production workload to characterize our usage patterns for clients running BRPOP. During non-peak workload, a 20-second survey showed 4K client connections calling BRPOP a total of 30K times, typically with the same long list of keys to block on. So when any of those keys enters a ready state, there are many clients to iterate through in serveClientsBlockedOnKeyByModule.
Comment From: filipecosta90
I believe it's extremely beneficial to assess why this happens with/without modules and if something can be done to improve it when modules are present also.
@filipecosta90 I completely agree with you. I think the crucial aspects of our workload that exposed this regression are that:
* Many client connections are concurrently running BRPOP on the same keys.

* When no modules are in use, `serveClientsBlockedOnKeyByModule` is doomed to walk the entire list of clients for every `BRPOP` command.

  * This is why the profile shows `serveClientsBlockedOnKeyByModule` spending nearly half of its time calling `listRotateHeadToTail` on its list of blocking clients.
For reference, I did a little extra profiling of our production workload to characterize our usage patterns for clients running
BRPOP. During non-peak workload, a 20-second survey showed 4K client connections calling BRPOP a total of 30K times, typically with the same long list of keys to block on. So when any of those keys enters a ready state, there are many clients to iterate through inserveClientsBlockedOnKeyByModule.
@igorwwwwwwwwwwwwwwwwwwww @matt-smiley:
To be 100% accurate of the simulation we want to make:
- large number of clients on same set of keys: 4K concurrent clients on the same standalone instance?
- do you guys have an expected number of given lists to pass BRPOP.?
- given we're simulating stuff do you also have an expected value size? ( even though not the focus here )
- small number of lists to push data to with X amount of producers doing RPUSH. do you have an expected amount of producers?
Comment From: igorwwwwwwwwwwwwwwwwwwww
@filipecosta90 I've hacked together a quick test case in go that reproduces the issue.
This is a very rough sketch that is not closely calibrated to what we are seeing in production, but it's close enough to show the effect. Here is macOS Instruments showing 16% of CPU time being spent in serveClientsBlockedOnKeyByModule.
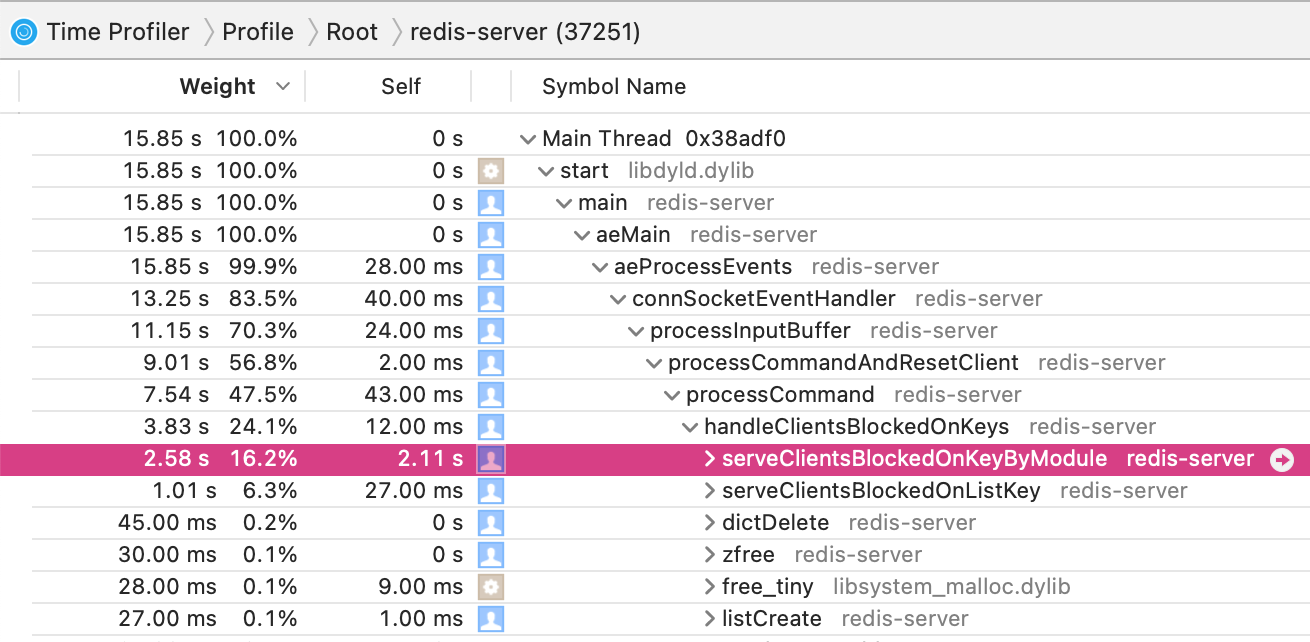
FYI, this was run against the stock redis 6.2.1 from Homebrew.
Test case:
package main

import (
    "context"
    "crypto/rand"
    "time"

    "github.com/go-redis/redis/v8"
)

// sudo sysctl -w kern.maxfiles=65000
// ulimit -S -n 16384

var Key = "foo"

func redisConsumer() {
    ctx := context.Background()
    rdb := redis.NewClient(&redis.Options{
        Addr: "127.0.0.1:6379",
    })

    n := 100
    keys := make([]string, n)
    for i := 0; i < n; i++ {
        keys[i] = Key
    }

    for {
        _, err := rdb.BLPop(ctx, time.Second, keys...).Result()
        if err == redis.Nil {
            continue
        }
        if err != nil {
            panic(err)
        }
    }
}

func redisProducer() {
    ctx := context.Background()
    rdb := redis.NewClient(&redis.Options{
        Addr: "127.0.0.1:6379",
    })

    for {
        b := make([]byte, 128)
        _, err := rand.Read(b)
        if err != nil {
            panic(err)
        }

        err = rdb.LPush(ctx, Key, b).Err()
        if err != nil {
            panic(err)
        }
    }
}

func main() {
    for i := 0; i < 1000; i++ {
        go redisConsumer()
    }

    for i := 0; i < 100; i++ {
        go redisProducer()
    }

    select {}
}
I hope this helps! :)
Comment From: matt-smiley
The test case by @igorwwwwwwwwwwwwwwwwwwww looks great to me.
Just for reference (since I already had it from the earlier pcap analysis), here is the distribution of the number of lists passed as arguments to BRPOP in our 20-second sample of the production workload. I don't think this distribution is particularly important for testing the patch; just sharing it for extra context.
First column is the count of BRPOP commands. Second column is the number of elements in the redis line protocol for the BRPOP command, so subtract 2 to get the number of keys passed as an argument to BRPOP. In this sample nearly half of the BRPOP commands shared the same 232 keys as arguments to BRPOP.
    545 *3
     25 *4
    248 *9
     72 *12
   3083 *18
   5718 *19
    429 *37
   7181 *96
  12650 *234