Hi,
I am using redis 3.2.5 version. The used_memory metric output given by redis info command is not matching with the used_memory on that machine. Can you please let me know if my understanding on using this metric is wrong with what I am expecting.
Note: Only redis running on that machine, and I double checked with top command and memory metric is not matching. MaxMemory is not set.
Comment From: badboy
Please show the output of INFO and the memory usage you see on that system
Comment From: Annapoornar
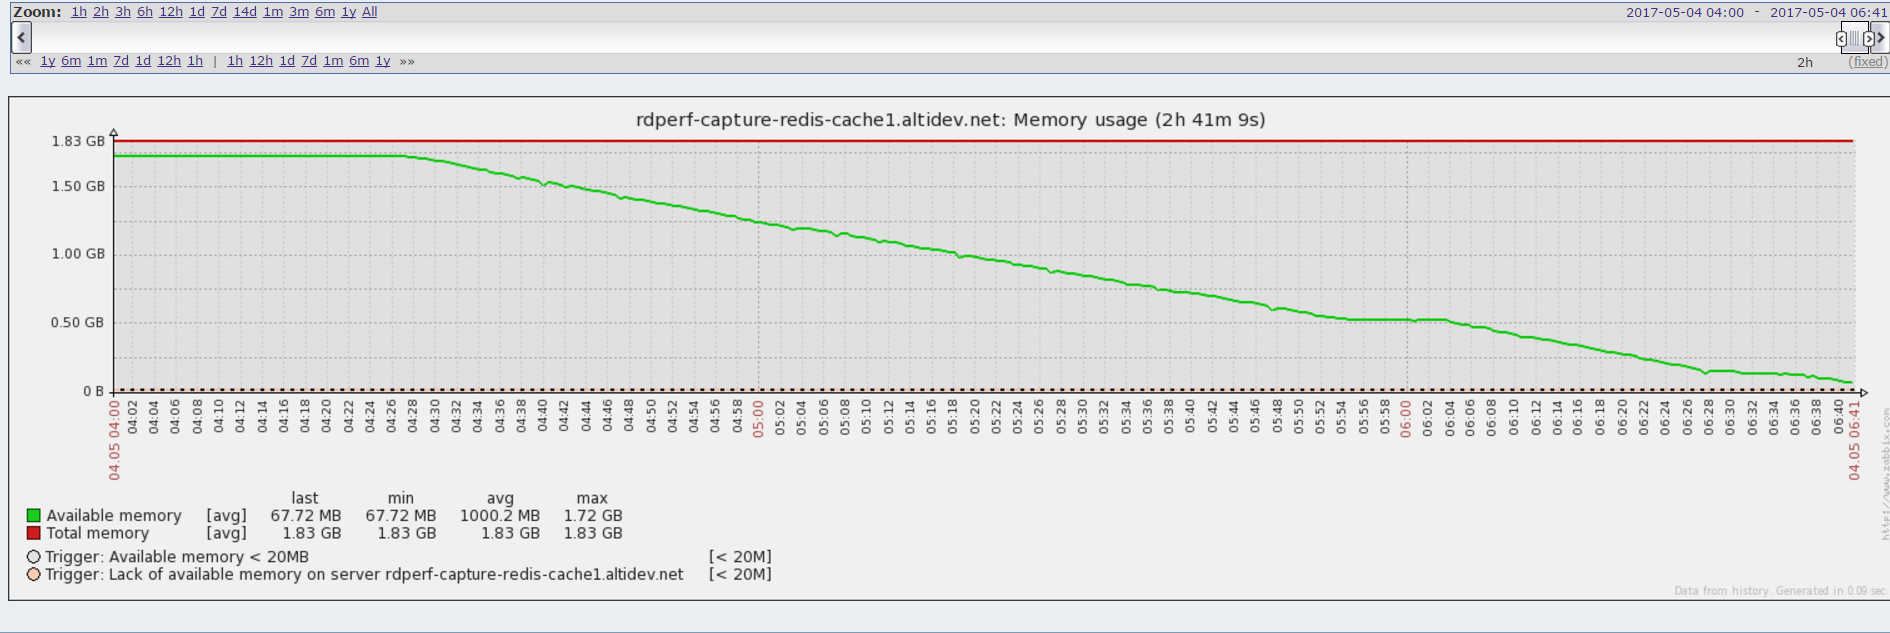
Even though 1.73 GB out of 2 GB RAM has been already utilized but redis response is as following:
on redis1 machine : rdperf-capture-redis-cache1.altidev.net
used_memory:787295152^M used_memory_human:750.82M^M used_memory_rss:887193600^M used_memory_rss_human:846.09M^M used_memory_peak:788222536^M used_memory_peak_human:751.71M^M total_system_memory:1966833664^M total_system_memory_human:1.83G^M used_memory_lua:37888^M used_memory_lua_human:37.00K^M maxmemory:0^M maxmemory_human:0B^M maxmemory_policy:noeviction^M mem_fragmentation_ratio:1.13^M mem_allocator:jemalloc-4.0.3^M
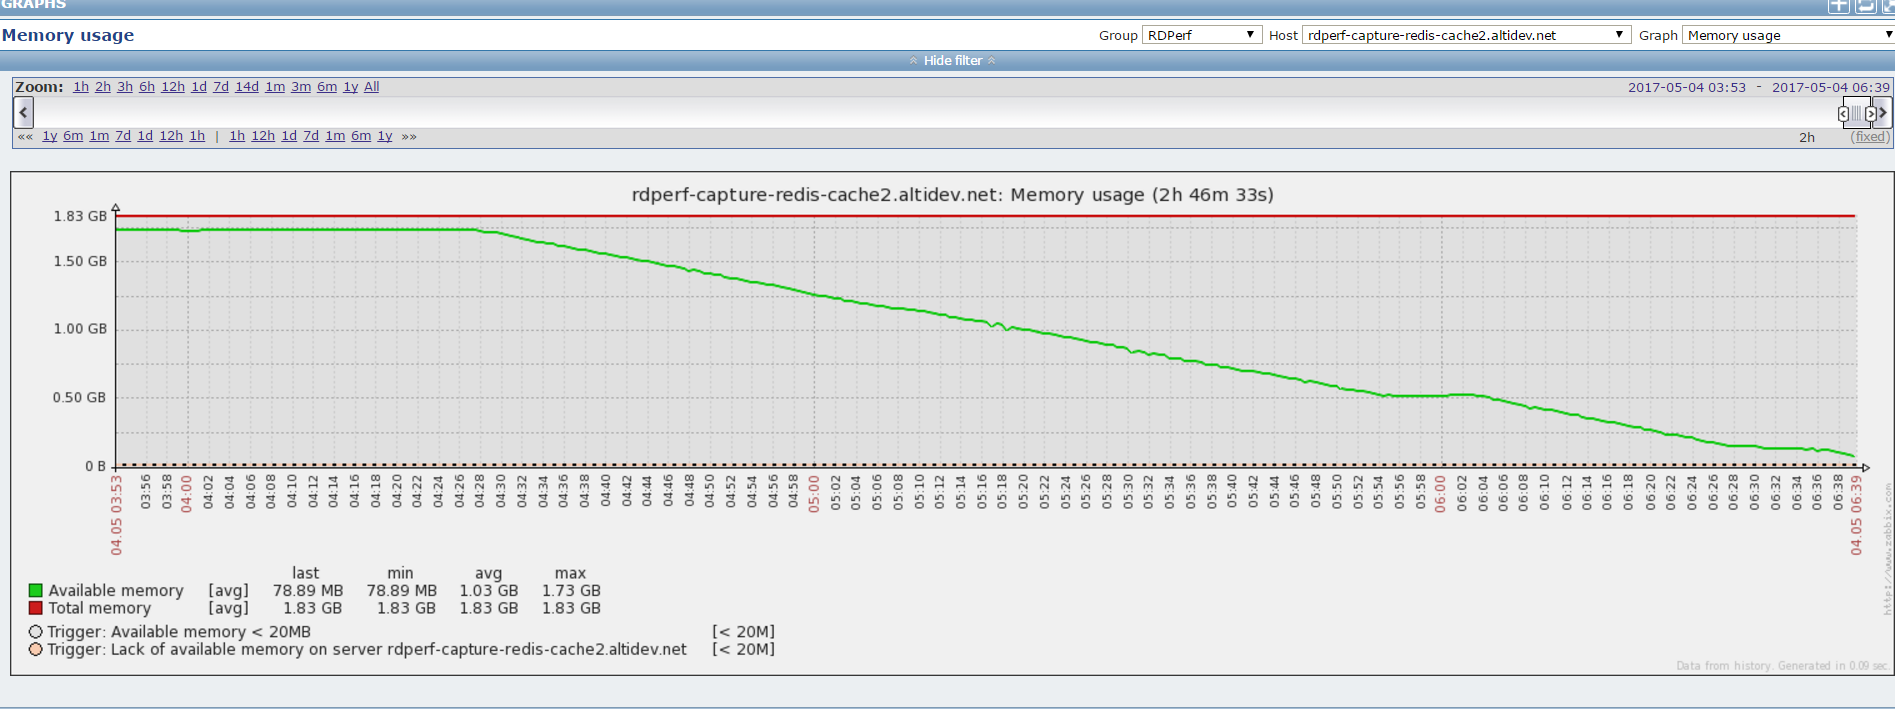
on redis1 machine : rdperf-capture-redis-cache2.altidev.net
used_memory:788531576^M used_memory_human:752.00M^M used_memory_rss:888913920^M used_memory_rss_human:847.73M^M used_memory_peak:789508128^M used_memory_peak_human:752.93M^M total_system_memory:1966833664^M total_system_memory_human:1.83G^M used_memory_lua:37888^M used_memory_lua_human:37.00K^M maxmemory:0^M maxmemory_human:0B^M maxmemory_policy:noeviction^M mem_fragmentation_ratio:1.13^M mem_allocator:jemalloc-4.0.3^M
I don't have top output but have snapshot of memory usage during that time from the profiler as below:
Comment From: mohit-chawla
Hi @Annapoornar and @badboy, were you able to make any progress on this?
Comment From: yossigo
@mohit-chawla The memory reported by top as RSS should match used_memory_rss. Some other things to look at --
- Other proceses; 2GB is not a lot these days, so overheads of other system processes could have an impact.
- Use
free -mto check available memory, I think at least on some systems Zabbix uses thefreevalue so buffer cache ends up being counted as used.
Comment From: mohit-chawla
@yossigo thanks for reply. Wanted to ensure that mem allocation is tracking correctly in redis and there is no suprise due to forked child processes or anything. For my case -- redis is running in a docker container and the memory usage reported by a tool monitoring the docker container is ~2 times the memory usage shown by used_memory_rss.
I ll investigate more and update my findings here.
Comment From: madolson
Going to assume that this was resolved.