We seem to have a performance regression with 2.4. The SampleActuatorApplication takes 0.5 seconds longer to run for me.
Comment From: dreis2211
CachedIntrospectionResults.getBeanInfo could be a thing to look at. Or whatever seems to trigger it more often now. But probably this is a regression in Spring-Framework rather than Boot.
2.4.0.SNAPSHOT
My time is limited at the moment, otherwise I would volunteer to fix this or at least investigate further.
Comment From: philwebb
My time is limited at the moment, otherwise I would volunteer to fix this or at least investigate further.
No worries, that analysis alone is super helpful!
Comment From: dreis2211
@philwebb Which versions are you comparing btw? I am currently comparing 2.3.2 vs. 2.4.0-SNAPSHOT and cannot really see the 500ms difference. Maybe 100ms - if at all. Which JDK are you using? I want to get as close to your setup as I can - maybe I can provide at least some more insights on this one...
Comment From: sdeleuze
Based on a discussion in #23147, setting -Dspring.beaninfo.ignore=false could be something to try (even if was not expecting that kind of impact).
Comment From: philwebb
:( I think we originally set it to true to try and improve performance.
Comment From: dreis2211
That needs some proper testing still - I wasn't very far with it yet. Benchmarking Introspector.getBeanInfo in isolation though yields the following results.
Benchmark                                                    Mode  Cnt      Score      Error   Units
MyBenchmark.beanInfoWithIgnore                               avgt   10  72207,788 ± 7550,716   ns/op
MyBenchmark.beanInfoWithIgnore:·gc.alloc.rate                avgt   10    677,887 ±   65,626  MB/sec
MyBenchmark.beanInfoWithIgnore:·gc.alloc.rate.norm           avgt   10  63960,015 ±  293,228    B/op
MyBenchmark.beanInfoWithIgnore:·gc.churn.G1_Eden_Space       avgt   10    679,296 ±   94,402  MB/sec
MyBenchmark.beanInfoWithIgnore:·gc.churn.G1_Eden_Space.norm  avgt   10  64132,960 ± 7085,231    B/op
MyBenchmark.beanInfoWithIgnore:·gc.churn.G1_Old_Gen          avgt   10      0,008 ±    0,006  MB/sec
MyBenchmark.beanInfoWithIgnore:·gc.churn.G1_Old_Gen.norm     avgt   10      0,737 ±    0,534    B/op
MyBenchmark.beanInfoWithIgnore:·gc.count                     avgt   10     56,000             counts
MyBenchmark.beanInfoWithIgnore:·gc.time                      avgt   10     26,000                 ms
MyBenchmark.beanInfoWithoutIgnore                            avgt   10     13,241 ±    1,495   ns/op
MyBenchmark.beanInfoWithoutIgnore:·gc.alloc.rate             avgt   10     ≈ 10⁻⁴             MB/sec
MyBenchmark.beanInfoWithoutIgnore:·gc.alloc.rate.norm        avgt   10     ≈ 10⁻⁶               B/op
MyBenchmark.beanInfoWithoutIgnore:·gc.count                  avgt   10        ≈ 0             counts
That obviously doesn't translate 1:1 to every application - in fact it highly depends on the Classloader setup etc. - but might be an option to counter the current performance regression. I would be interested if this makes a difference on your machine @philwebb
Comment From: dreis2211
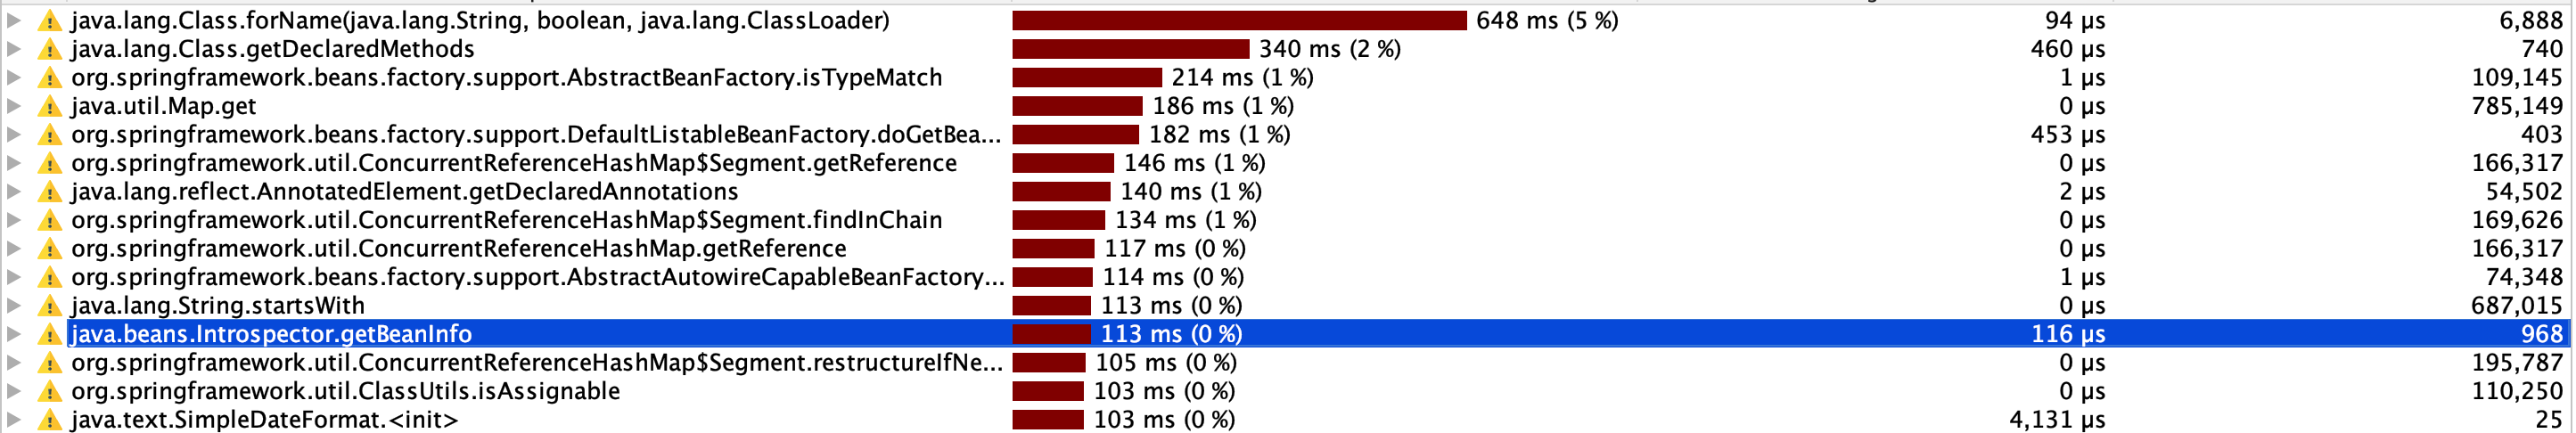
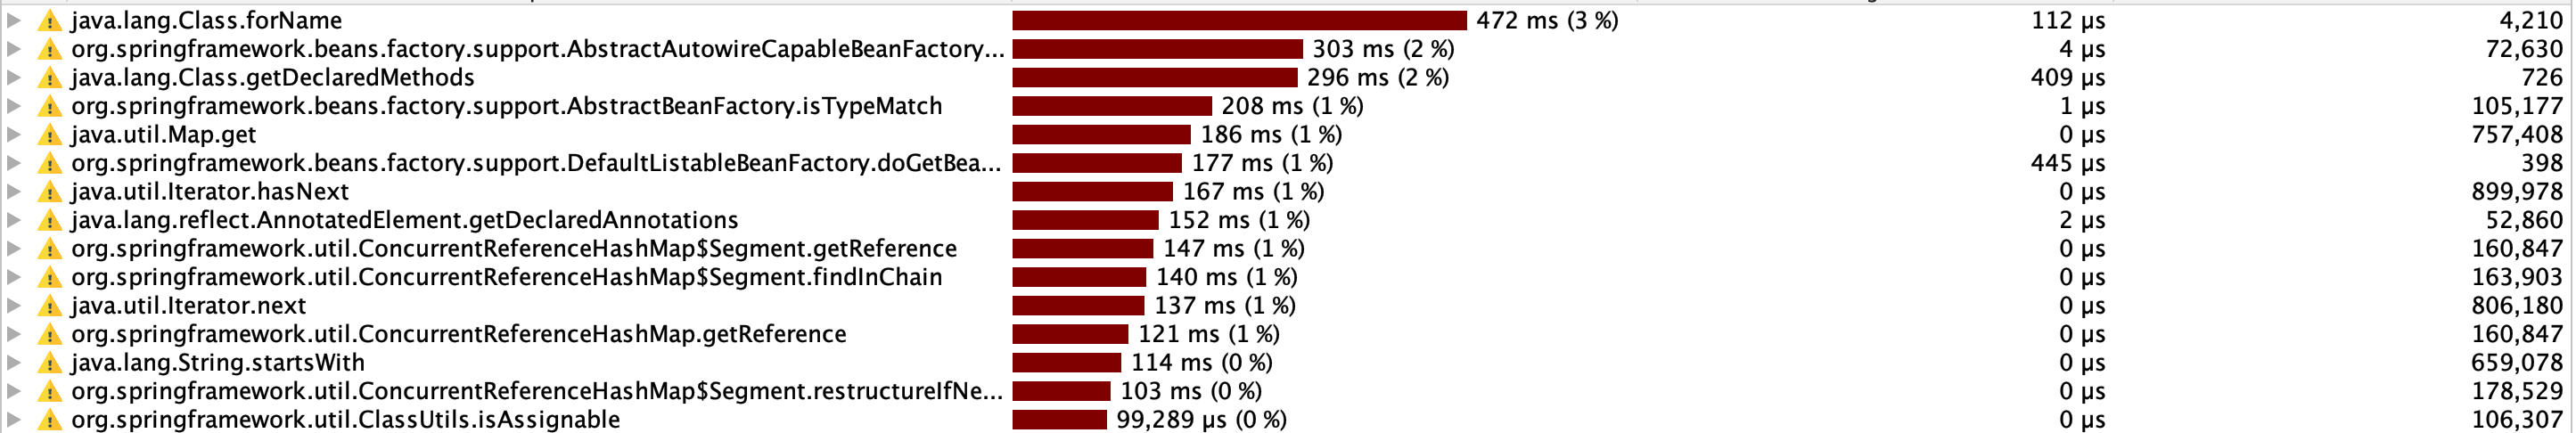
Okay, setting the beaninfo stuff aside for the time being, I can reproduce this now when running the fat jar and see difference ranging from 500ms to 1 second even. The profilings yield some other very interesting results (top 2.4.0.SNAPSHOT vs bottom 2.3.2.RELEASE):
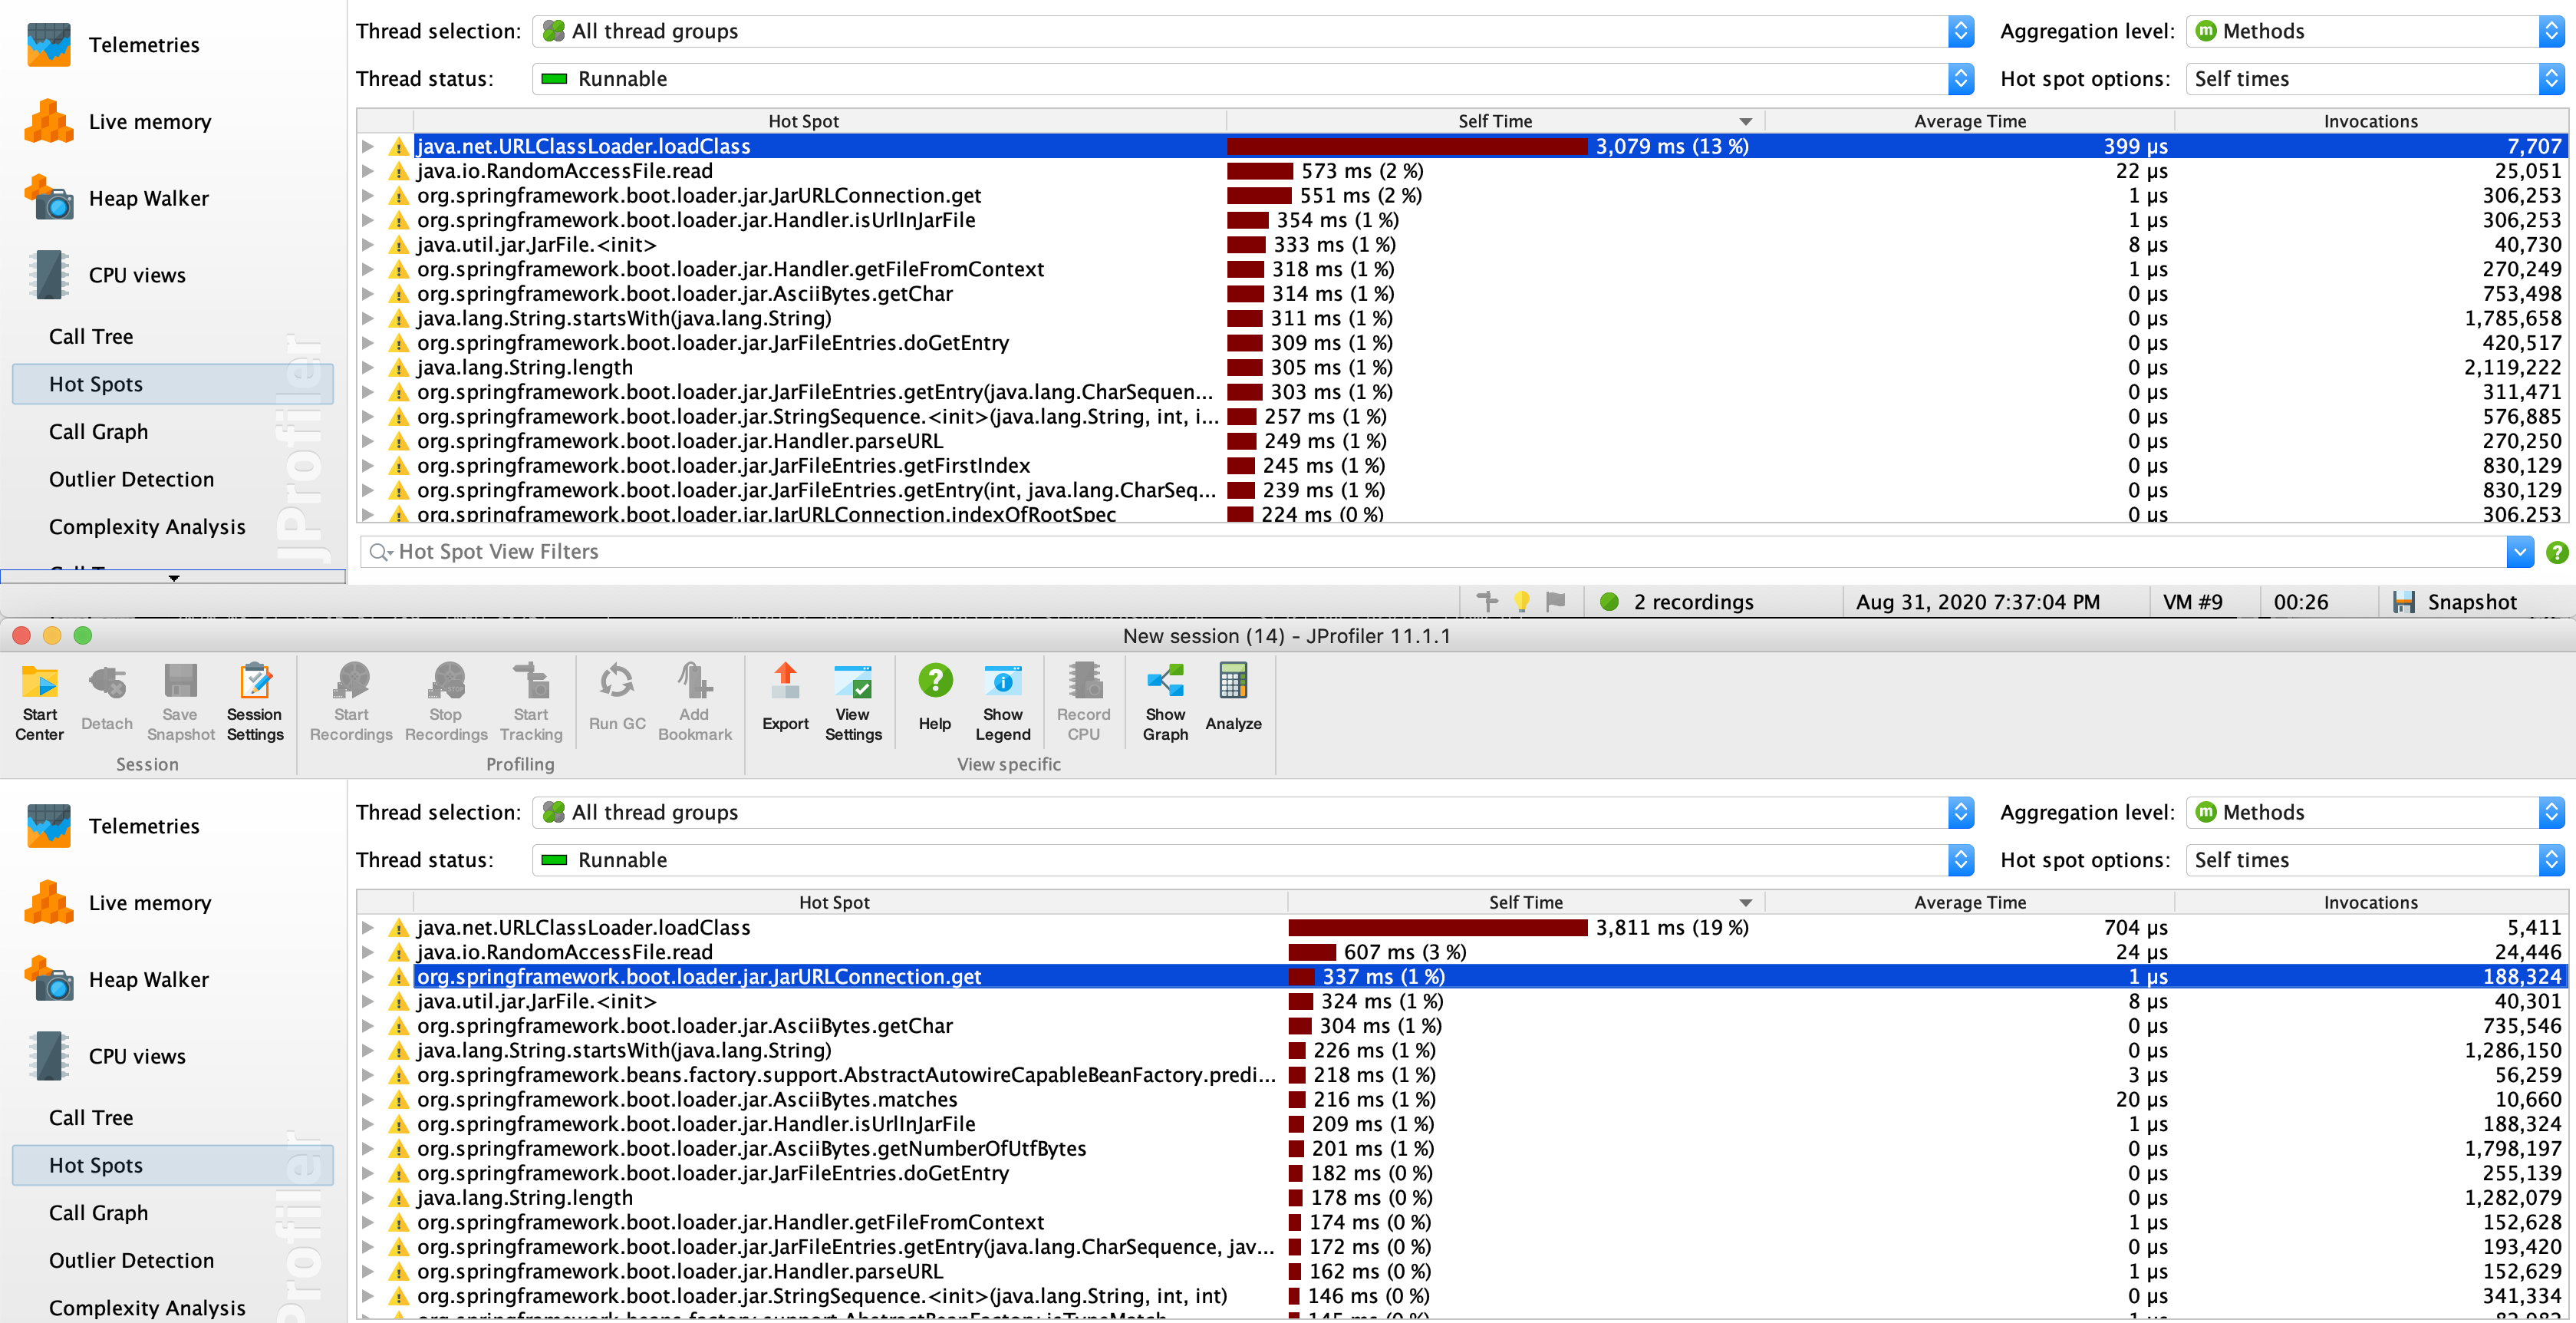
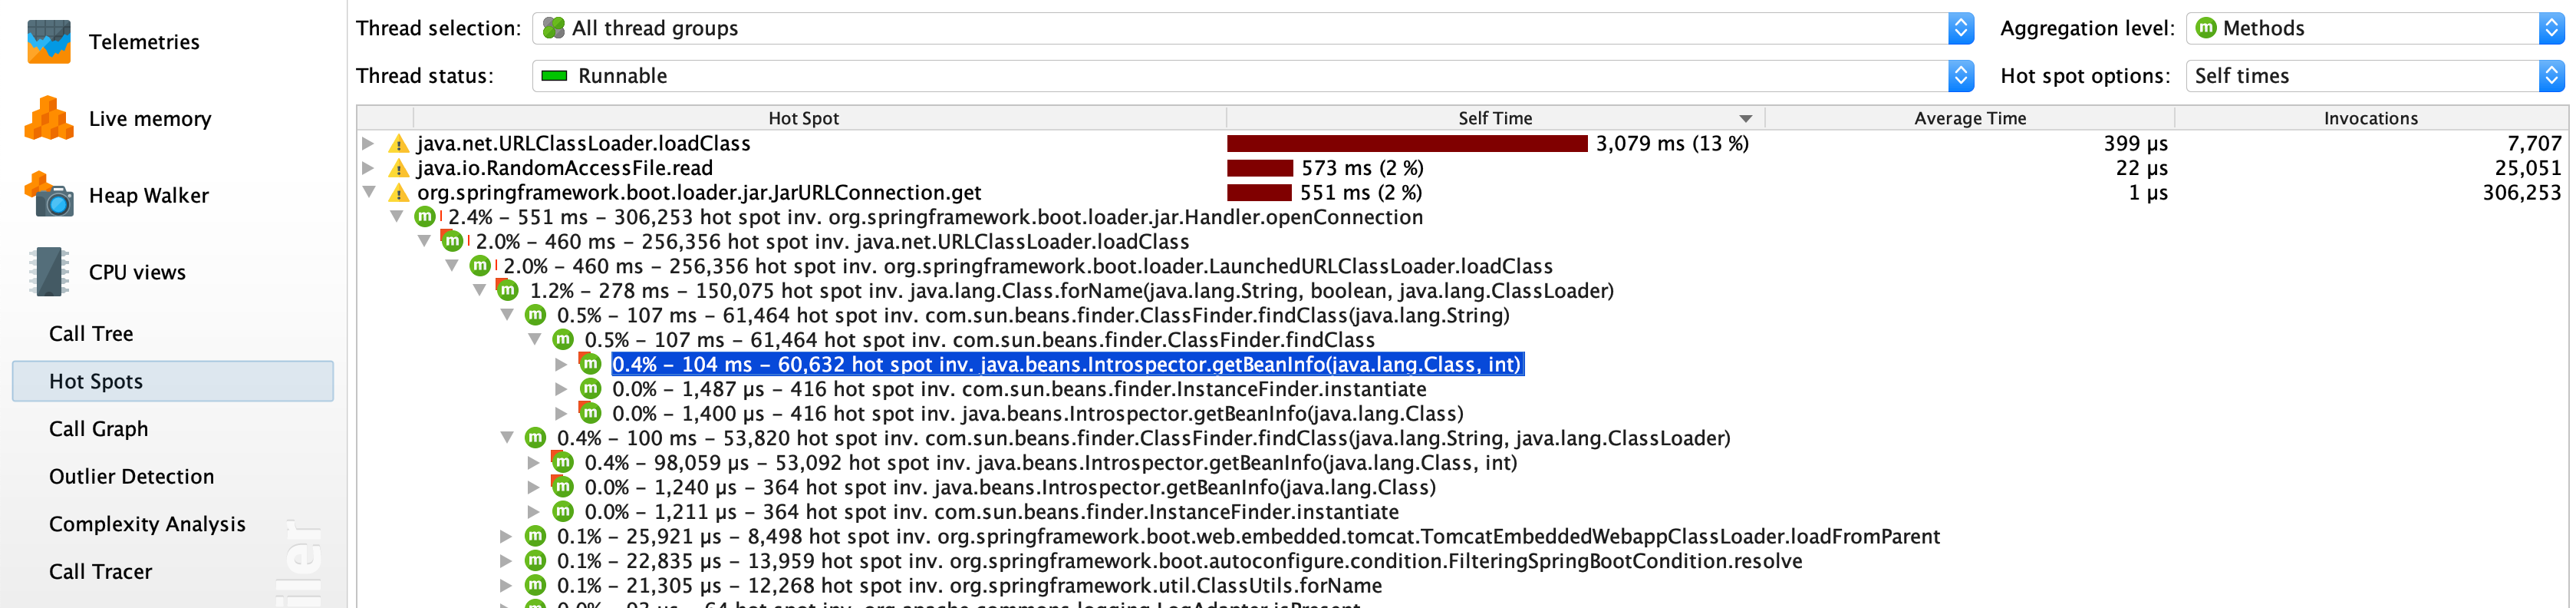
When zooming in on the 2.4.0 profiling this again confirms the initial analysis of a performance decrease likely caused by triggering more calls to Introspector.getBeanInfo/CachedIntrospectionResults:
Comment From: dreis2211
The unfortunate bit about this is the fact that the code that seems to trigger most of the stuff is deprecated as of Spring-Framework 5.1 already:
See https://github.com/spring-projects/spring-framework/blame/master/spring-beans/src/main/java/org/springframework/beans/factory/support/AbstractAutowireCapableBeanFactory.java#L1420
for (InstantiationAwareBeanPostProcessor bp : getBeanPostProcessorCache().instantiationAware) {
    PropertyValues pvsToUse = bp.postProcessProperties(pvs, bw.getWrappedInstance(), beanName);
    if (pvsToUse == null) {
        if (filteredPds == null) {
                         // This seems to trigger most of the expensive usages of CachedIntrospectionResults
            filteredPds = filterPropertyDescriptorsForDependencyCheck(bw, mbd.allowCaching);
        }
                 // postProcessPropertyValues() is deprecated as of 5.1 and makes expensive filtering above obsolete
        pvsToUse = bp.postProcessPropertyValues(pvs, filteredPds, bw.getWrappedInstance(), beanName);
        if (pvsToUse == null) {
            return;
        }
    }
    pvs = pvsToUse;
}
Comment From: philwebb
Perhaps it's this change https://github.com/spring-projects/spring-framework/commit/a3c5625d4e1e2b5ca720b8e74797ee8bd30f54e4 by @jhoeller?. It's fairly recent.
Comment From: dreis2211
I don't see how the mentioned change should actually (negatively) affect this - given that it only changed the way how it iterates over BeanPostProcessors. In fact I proposed that in order to save some cycles for unnecessary iterating over not relevant processors... But maybe there is a strange side-effect that I don't see yet.
Comment From: dreis2211
I think the regression was introduced with https://github.com/spring-projects/spring-framework/commit/7207f7645c7d48392d8d7518a9da305b2090c12d . The changes in AbstractAutoProxyCreator lead to the default implementation of postProcessProperties returning null, while it previously returned the (empty) PropertyValues. Again - if we would remove the deprecated call to postProcessPropertyValues there would be no need for the expensive filtering at all imho.
Comment From: jhoeller
Good catch, @dreis2211 - I'll restore the redeclared method in AbstractAutoProxyCreator with the shortcut return value. That subtlety unfortunately slipped through, I thought the methods were identical to the default methods in the interface anyway.
Comment From: dreis2211
What about removing the deprecated postProcessPropertyValues, @jhoeller ? That would solve a lot of those subtle issues, if you ask me...
Comment From: jhoeller
It's a very old callback (somewhat widely used for dependency injection purposes) so I'd rather keep it intact for the time being and remove it in 6.0. But yeah, it'll be better once it's removed.
Comment From: dreis2211
Fair enough...
Comment From: philwebb
Restored in https://github.com/spring-projects/spring-framework/commit/278c6d5cdb68a45df163c9da19734b22b5f5c2d2