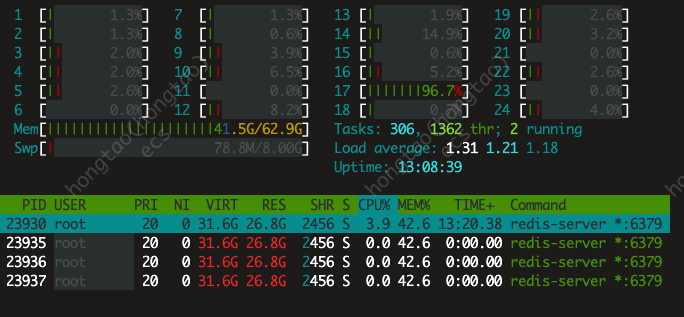
via memory-tools inspected, redis process using memory actual(26G+). but via redis-cli memory stats, it found that much little than, it was only 25+M.
[INFO ALL] Server redis_version:6.2.6 redis_git_sha1:00000000 redis_git_dirty:0 redis_build_id:84dfb40eb1119e5 redis_mode:standalone os:Linux 4.15.0-163-generic x86_64 arch_bits:64 multiplexing_api:epoll atomicvar_api:atomic-builtin gcc_version:10.2.1 process_id:1 process_supervised:no run_id:f0d452014419ca9db5fd758ac16451d2d971b04b tcp_port:6379 server_time_usec:1641520873530007 uptime_in_seconds:47460 uptime_in_days:0 hz:10 configured_hz:10 lru_clock:14130921 executable:/data/redis-server config_file: io_threads_active:0
Clients connected_clients:10 cluster_connections:0 maxclients:10000 client_recent_max_input_buffer:56 client_recent_max_output_buffer:0 blocked_clients:0 tracking_clients:0 clients_in_timeout_table:0
Memory used_memory:26200736 used_memory_human:24.99M used_memory_rss:33804288 used_memory_rss_human:32.24M used_memory_peak:26382840 used_memory_peak_human:25.16M used_memory_peak_perc:99.31% used_memory_overhead:2094648 used_memory_startup:809880 used_memory_dataset:24106088 used_memory_dataset_perc:94.94% allocator_allocated:26244832 allocator_active:26550272 allocator_resident:30838784 total_system_memory:67504685056 total_system_memory_human:62.87G used_memory_lua:32768 used_memory_lua_human:32.00K used_memory_scripts:216 used_memory_scripts_human:216B number_of_cached_scripts:1 maxmemory:0 maxmemory_human:0B maxmemory_policy:noeviction allocator_frag_ratio:1.01 allocator_frag_bytes:305440 allocator_rss_ratio:1.16 allocator_rss_bytes:4288512 rss_overhead_ratio:1.10 rss_overhead_bytes:2965504 mem_fragmentation_ratio:1.29 mem_fragmentation_bytes:7646344 mem_not_counted_for_evict:0 mem_replication_backlog:0 mem_clients_slaves:0 mem_clients_normal:205120 mem_aof_buffer:0 mem_allocator:jemalloc-5.1.0 active_defrag_running:0 lazyfree_pending_objects:0 lazyfreed_objects:0
Persistence loading:0 current_cow_size:0 current_cow_size_age:0 current_fork_perc:0.00 current_save_keys_processed:0 current_save_keys_total:0 rdb_changes_since_last_save:12 rdb_bgsave_in_progress:0 rdb_last_save_time:1641520685 rdb_last_bgsave_status:ok rdb_last_bgsave_time_sec:0 rdb_current_bgsave_time_sec:-1 rdb_last_cow_size:1064960 aof_enabled:0 aof_rewrite_in_progress:0 aof_rewrite_scheduled:0 aof_last_rewrite_time_sec:-1 aof_current_rewrite_time_sec:-1 aof_last_bgrewrite_status:ok aof_last_write_status:ok aof_last_cow_size:0 module_fork_in_progress:0 module_fork_last_cow_size:0
Stats total_connections_received:13 total_commands_processed:26280 instantaneous_ops_per_sec:0 total_net_input_bytes:1037087 total_net_output_bytes:299508 instantaneous_input_kbps:0.00 instantaneous_output_kbps:0.00 rejected_connections:0 sync_full:0 sync_partial_ok:0 sync_partial_err:0 expired_keys:0 expired_stale_perc:0.00 expired_time_cap_reached_count:0 expire_cycle_cpu_milliseconds:1060 evicted_keys:0 keyspace_hits:1610 keyspace_misses:7206 pubsub_channels:4 pubsub_patterns:2 latest_fork_usec:857 total_forks:32 migrate_cached_sockets:0 slave_expires_tracked_keys:0 active_defrag_hits:0 active_defrag_misses:0 active_defrag_key_hits:0 active_defrag_key_misses:0 tracking_total_keys:0 tracking_total_items:0 tracking_total_prefixes:0 unexpected_error_replies:0 total_error_replies:0 dump_payload_sanitizations:0 total_reads_processed:23064 total_writes_processed:25489 io_threaded_reads_processed:0 io_threaded_writes_processed:0
Replication role:master connected_slaves:0 master_failover_state:no-failover master_replid:1a440762d2098c345489f9f04c55e7980a739e7f master_replid2:0000000000000000000000000000000000000000 master_repl_offset:0 second_repl_offset:-1 repl_backlog_active:0 repl_backlog_size:1048576 repl_backlog_first_byte_offset:0 repl_backlog_histlen:0
CPU used_cpu_sys:12.980221 used_cpu_user:18.838734 used_cpu_sys_children:0.416413 used_cpu_user_children:4.085105 used_cpu_sys_main_thread:12.812211 used_cpu_user_main_thread:18.711555
Modules
Commandstats cmdstat_ping:calls=9483,usec=7304,usec_per_call=0.77,rejected_calls=0,failed_calls=0 cmdstat_llen:calls=4745,usec=9798,usec_per_call=2.06,rejected_calls=0,failed_calls=0 cmdstat_command:calls=1,usec=547,usec_per_call=547.00,rejected_calls=0,failed_calls=0 cmdstat_config:calls=4,usec=137,usec_per_call=34.25,rejected_calls=0,failed_calls=0 cmdstat_subscribe:calls=3,usec=24,usec_per_call=8.00,rejected_calls=0,failed_calls=0 cmdstat_get:calls=1695,usec=4053,usec_per_call=2.39,rejected_calls=0,failed_calls=0 cmdstat_eval:calls=1610,usec=43508,usec_per_call=27.02,rejected_calls=0,failed_calls=0 cmdstat_info:calls=1,usec=6,usec_per_call=6.00,rejected_calls=0,failed_calls=0 cmdstat_set:calls=2373,usec=18378,usec_per_call=7.74,rejected_calls=0,failed_calls=0 cmdstat_smembers:calls=2376,usec=5694,usec_per_call=2.40,rejected_calls=0,failed_calls=0 cmdstat_select:calls=3,usec=4,usec_per_call=1.33,rejected_calls=0,failed_calls=0 cmdstat_del:calls=3983,usec=13083,usec_per_call=3.28,rejected_calls=0,failed_calls=0 cmdstat_psubscribe:calls=3,usec=17,usec_per_call=5.67,rejected_calls=0,failed_calls=0
Errorstats
Cluster cluster_enabled:0
Keyspace db0:keys=20416,expires=11,avg_ttl=10540997 db8:keys=3,expires=3,avg_ttl=16851925
[HTOP MERTIC]
Comment From: oranagra
are you sure you're looking at the same process?
used_memory:26,200,736
used_memory_rss:33,804,288
used_memory_peak:26,382,840
allocator_allocated:26,244,832
allocator_active:26,550,272
allocator_resident:30,838,784
The RSS reported by the system, as well at the allocator itself, and all other memory metrics, are at around 30mb.
you you can still observe this, maybe get the output of /proc/<pid>/smaps
Comment From: Jeremy-Run
HTOP is the native Redis process memory usage. INFO report is the memory usage of the Redis server to which the client is connected.
Comment From: hongtaoxy
Found that there is a redis in an application