The problem/use-case that the feature addresses
A customer reached out to ask why their memory usage is very high. The customer had 40 bytes values and roughly 900 million keys. They compute the memory usage by doing key size * keyspace size. They observed a near 200% memory usage overhead on their production Redis server. A triage done by me showed that over half of the overhead was from the slotToKey rax tree.
As a small experiment. I took the rax.c and rax.h files and compiled them into a small program. Inserting 484 Million keys into the rax tree yielded 48GB of memory usage. This is about 99 bytes per key.
The proposed solution would display the slotToKey rax tree as an overhead in the MEMORY STATS command output. This would allow Redis users to inspect and understand their memory usage in more detail.
Description of the feature
Add another field into the rax struct to track allocation size.
Update the allocation size on rax insert and deletes.
Return the allocation size when raxAllocSize is called.
Retrieve the allocation size of the slotToKey rax tree when MEMORY STATS is called.
Alternatives you've considered
n/a
Additional information
n/a
Comment From: yzhaon
Opening this issue to gather initial feedback.
Comment From: yzhaon
Please note that after this commit https://github.com/redis/redis/commit/f24c63a292e045d4b14b82b25981f00a95c1767a The slotToKey mapping has been converted from a rax tree to a linked list implementation. Thus the original motivation for building the feature for understanding slotToKey overhead using the raxAllocSize function doesn't work in unstable branch. Thanks @madolson for pointing this out.
There is still value in the raxAllocSize function as it returns the rax tree allocation size. But the original problem described on the issue here won't be solved using it.
Comment From: oranagra
it's not really possible to compute the rax tree memory usage in a reasonable time complexity, see the streamRadixTreeMemoryUsage method and the big comment above it.
if you have a way to do that, please suggest it, otherwise i think keeping this issue open is useless (especially considering that the original motivation for it is no longer relevant).
on the other hand, you did also suggest to show the the slotToKey overhead in MEMORY STATS, and that's now quite easy to do, feel free to make a PR.
Comment From: madolson
I think the proposal was going to be something along the lines of keeping track of the memory constantly. One of the features I want us to evaluate in depth in the future is keeping track of all the memory allocated with the various types of objects so that it could become trivial to keep a small sorted structure of the largest keys. Many of our users have never been happy with the approximate algorithms provided.
If there was a way we could keep track of the memory without incurring additional memory cost for objects the user doesn't want to track (something where above a certain size we start tracking), I think that would be a cool feature.
I don't think we should track that here though.
Comment From: yzhaon
it's not really possible to compute the rax tree memory usage in a reasonable time complexity, see the streamRadixTreeMemoryUsage method and the big comment above it.
Yes. I agree.
The proposed implementation here for raxAllocSize is:
* create new 64bit field in rax data structure to track size
* adjust size variable according to allocations and de-allocations done on each insertion and deletion
* return the size variable when raxAllocSize is called
The work to keep the size updated is done incrementally during each insert and delete. Assuming that there are no concurrent mutations on a rax tree. This method should return the current size.
on the other hand, you did also suggest to show the the slotToKey overhead in MEMORY STATS, and that's now quite easy to do, feel free to make a PR.
Ok. Going to create a PR for that.
Comment From: oranagra
keeping track of memory usage incrementally could have a performance hit.
the obvious thing is the extra memory.
currently AFAICT a rax with one key of a single char keyname will consume 48 bytes (includes some internal fragmentation).
so adding another member to the rax struct, will consume an additional 8 bytes.
that might not be that bad, considering most rax trees are much bigger so the overhead is relatively small.
and the edge case of storing many many single node rax trees is probably negligible.
The other performance hit is the the updates (calling zmallc_size, and updating the struct member).
I suppose there are no cases where the main rax is not in the CPU cache when adding or freeing an allocation, since we have to also update numele and numnodes, so maybe this won't have a real impact.
regarding zmallc_size, maybe we can call zmalloc_usable instead (it's not exactly the same thing, but maybe better than nothing, and would be faster).
Bottom line, i was at first skeptical, thinking that dispersing the effort over many calls, can make it non-measurable, but we'll still pay the price, but after this analysis i think it may be ok. We can try to implement and benchmark it. Then use it instead of streamRadixTreeMemoryUsage for an accurate MEMORY USAGE for streams (i do know of some people that will be happy to get an accurate reading)
Comment From: yzhaon
Create a PR for the MEMORY STAT size reporting.
There was one ACL tcl test that failed. But make test worked again on retry.
Comment From: yzhaon
I am working on the implementation for tracking the allocation size.
I have a few questions regarding the implementation.
- For benchmarking, what are we expecting to measure from the benchmark?
- Obviously we need to measure the insert and delete performance. I'm thinking throughput and latency.
- Do we need to measure memory usage as well here? I think we can skip it since it should be negligible.
- What benchmarking tool can we use here?
- AFAIK redis-benchmark doesn't support the STREAM data structure. I searched the issue backlog and found https://github.com/redis/redis/pull/6015. Which mentions a benchmark tool called https://openmessaging.cloud/docs/benchmarks/. Is this the standard for benchmarking STREAMS? Are there any reference results?
-
Or should we just compile a program to run raxInsert and raxRemove on repeat to measure performance?
-
Do we need to implement unit tests for this feature?
- I see existing tests for the STREAM data structure. However I don't see any tests for the underlying rax data structure.
Comment From: oranagra
- i think testing insertion and deletion is enough.. we can already understand the implication on memory consumption and decided we can live with that.
- i'm not sure about benchmark for streams. maybe @filipecosta90 knows of one. maybe you can use memtier_benchmark.
- testing raxInsert and raxRemove directly could be a good idea. if the impact is low, maybe there's no need to test streams. if it appears to be high, we might want to test streams to understand the real impact.
- there are some rax tests here: https://github.com/antirez/rax maybe we need to move them into our repo (same as we have tests for listpack and others)
Comment From: yzhaon
Benchmark results
I have created a benchmark here on my branch yzhaon/yzhaon-rax-centile https://github.com/yzhaon/redis/commit/d92f74f62705dfd539b67758f20e22d3ed21ac90 and yzhaon/yzhaon-rax-centile-alloc https://github.com/yzhaon/redis/commit/0a1bc7c3da7873f2e60e2fe63a11844ef362a67a branches.
The benchmark pre-creates K random strings. These strings are inserted into a rax tree. Time measurements are done after N insertions, where N is a power of 2 number that double after each measurement as well. This allows the benchmark to produce a logarithmic X axis of data sizes. Time is measured using the Redis function ustime() but converted to nanoseconds when calculating averages.
Benchmark was ran on AWS EC2 r5.4xlarge dedicated instance. There isn't any noise due to noisy neighbours as the EC2 instance occupies the entire hardware droplet.
I produced 3 charts. raxFind, raxInsert, and raxRemove. The Y axis of the graphs is the average time it takes to run N operations in nanoseconds.
The blue series data are the reference results captured using the yzhaon/yzhaon-rax-centile branch. This branch has no rax.c changes and is branched off of the same common ancestor commit of the rax.c commit.
The orange series data are results from yzhaon/yzhaon-rax-centile-alloc branch. This branch contains the size update changes. The branch uses the zmalloc_size function to get the size of a pointer.
The gray series data are also from yzhaon/yzhaon-rax-centile-alloc branch. With the following patch applied:
diff --git a/src/rax_malloc.h b/src/rax_malloc.h
index 357fe0491..cd74c14b3 100644
--- a/src/rax_malloc.h
+++ b/src/rax_malloc.h
@@ -41,5 +41,5 @@
 #define rax_malloc zmalloc
 #define rax_realloc zrealloc
 #define rax_free zfree
-#define rax_alloc_size zmalloc_size
+#define rax_alloc_size raxNodeCurrentLength
 #endif
This data uses raxNodeCurrentLength to retrieve the size of a pointer. This is mostly correct as raxNodeCurrentLength is called to calculate the allocation size when creating a rax node. The only exception being when realloc fails while running raxRemove. We can choose to patch this case explictly if we decide to use raxNodeCurrentLength as the sizing function.
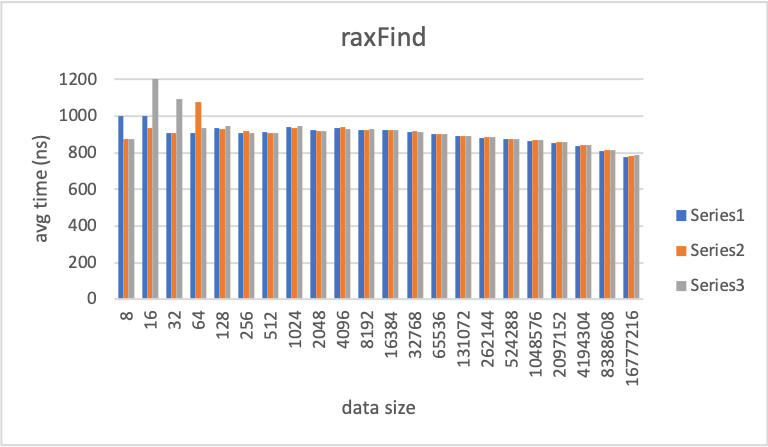
The raxFind chart is used as a baseline for the benchmark. Since the total rax size isn't touched in the raxFind code. The results from all three runs should be the same.
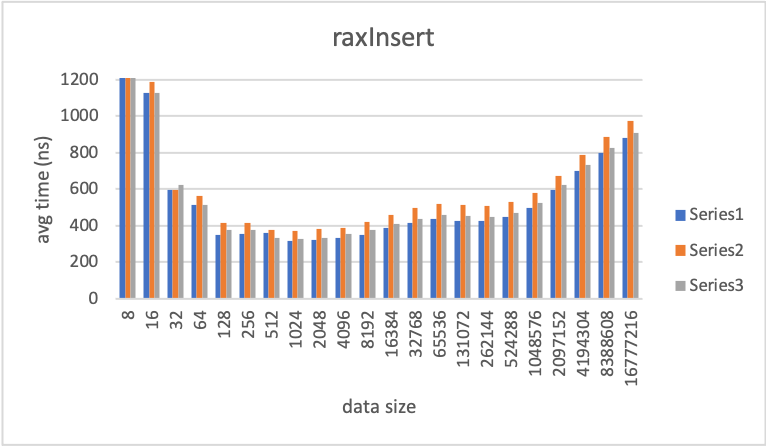
The raxInsert chart shows a significant increase for the orange series data.
The zmalloc data shows a 10% to 20% time increase compared to the reference. The tail data size time for 16777216 has an 10% increase over reference. The max time increase of 20% happens for the 8192 data size over reference.
The raxNodeCurrentLength data shows a 3% to 7% increase compared to reference. The tail data size time for 16777216 has an 3% increase over reference. The max time increase of 7% happens for the 4096 data size over reference.
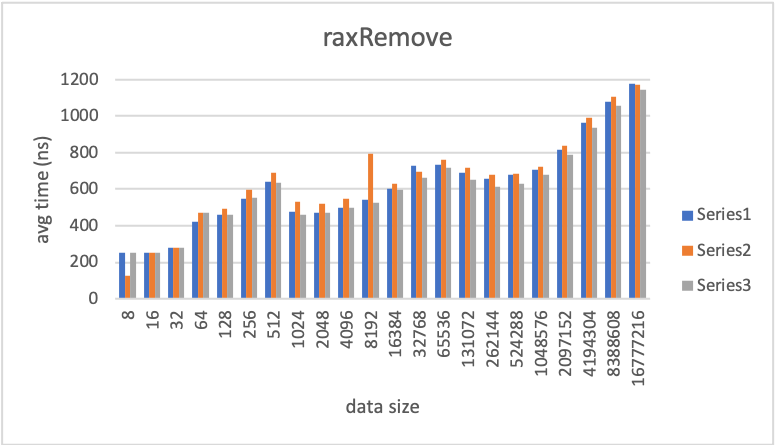
The raxRemove data is a bit confusing. The percent increase between zmalloc to reference and raxNodeCurrentLength to reference are both not really significant and within an margin of error.
Comparing zmalloc to reference there is about 0% to 11% time increase. Excluding the one occurrence of 8192 which is an 46% increase. The tail data size time for 16777216 is almost equal to reference The biggest time increase is 11% for the data size 1024.
The raxNodeCurrentLength data mostly showed a performance improvement compared to reference. Not exactly sure why here.
In my opinion, the results from using zmalloc_size are not bad. If we are concerned here we can go with the raxNodeCurrentLength approach and manually fixup the realloc size difference in raxRemove.
Comment From: oranagra
@yzhaon thank you for this detailed benchmark. sorry for responding so late, we were all very busy with redis 7.0 features that must have been completed before the release. now that it's over, we can focus on smaller changes and fixes like this one.
I agree performance loss from using zmalloc_size isn't very high.
i don't think the raxNodeCurrentLength approach is valid, specifically because it doesn't include internal fragmentation.
but maybe you can try benchmarking one more alternative?
instead of calling zmalloc_size we can use zmalloc_usable, which does both the allocation and returns the size, without an additional call.
The reason it isn't as simple as it sounds is that "usable" in actually not what we want, since it's equivalent to zmalloc_usable_size, which could be different than zmalloc_size.
so if we'll want to proceed in this direction, we'll need to add PREFIX_SIZE in some way (we can worry about that later).