since https://github.com/redis/redis/pull/9166 fix due to #10020 we've largely increased the amount of times we call getClientType() on a single command. LRANGE is a good example because we call getClientType() for all reply elements.
As we can see below, this is visible even on small reply sizes -- on a 10 elements reply we drop from 640K ops/sec on v6.2.6 to 626K ops/sec on unstable, which is a drop we can directly connect to the increase of CPU cycles spent on getClientType() -- ~3%.
@ShooterIT is there some logic/#calls we can reduce to avoid this extra CPU consumption? PS: this was caught via https://github.com/redis/redis-benchmarks-specification/blob/main/redis_benchmarks_specification/test-suites/memtier_benchmark-1key-list-10-elements-lrange-all-elements.yml
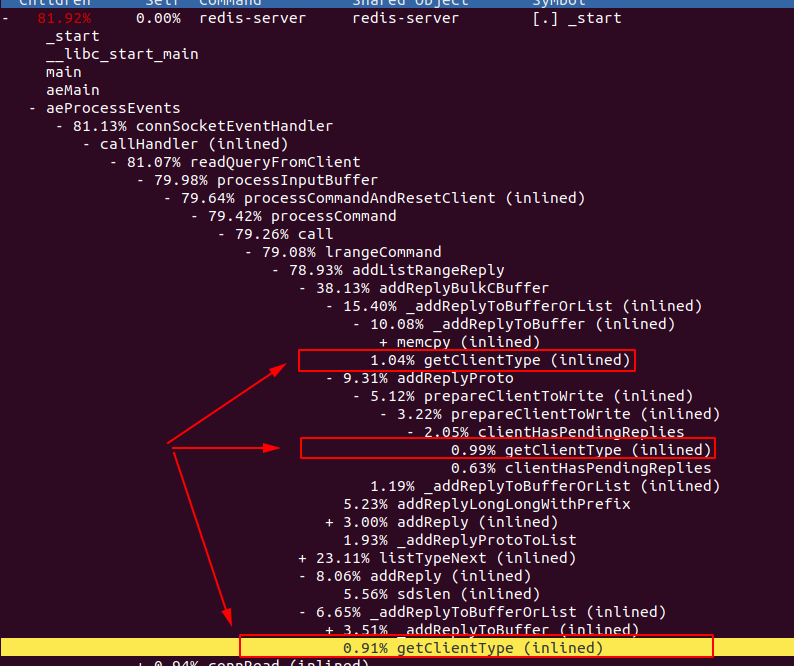
confirmation with profile data
v6.2.6 profile

unstable (81926254586f64fc6a9b393bf9afb0d2eacc5234)
benchmark info
To populate the data:
"RPUSH" "list:10" "lysbgqqfqw" "mtccjerdon" "jekkafodvk" "nmgxcctxpn" "vyqqkuszzh" "pytrnqdhvs" "oguwnmniig" "gekntrykfh" "nhfnbxqgol" "cgoeihlnei"
To benchmark:
quick check on an LRANGE command reply with a 10 elements list:
v6.2.6
root@hpe10:~/redis# taskset -c 1-5 memtier_benchmark --command="LRANGE list:10 0 -1"  --hide-histogram --test-time 60 --pipeline 10
Writing results to stdout
[RUN #1] Preparing benchmark client...
[RUN #1] Launching threads now...
[RUN #1 100%,  60 secs]  0 threads:    38447210 ops,  641149 (avg:  640765) ops/sec, 133.91MB/sec (avg: 133.83MB/sec),  3.11 (avg:  3.11) msec latency

4         Threads
50        Connections per thread
60        Seconds


ALL STATS
==================================================================================================
Type         Ops/sec    Avg. Latency     p50 Latency     p99 Latency   p99.9 Latency       KB/sec
--------------------------------------------------------------------------------------------------
Lranges    640765.27         3.11013         3.34300         4.25500         4.54300    137038.67
Totals     640765.27         3.11013         3.34300         4.25500         4.54300    137038.67
unstable
root@hpe10:~/redis# taskset -c 1-5 memtier_benchmark --command="LRANGE list:10 0 -1"  --hide-histogram --test-time 60 --pipeline 10
Writing results to stdout
[RUN #1] Preparing benchmark client...
[RUN #1] Launching threads now...
[RUN #1 100%,  60 secs]  0 threads:    37609260 ops,  627934 (avg:  626798) ops/sec, 131.15MB/sec (avg: 130.91MB/sec),  3.17 (avg:  3.18) msec latency

4         Threads
50        Connections per thread
60        Seconds


ALL STATS
==================================================================================================
Type         Ops/sec    Avg. Latency     p50 Latency     p99 Latency   p99.9 Latency       KB/sec
--------------------------------------------------------------------------------------------------
Lranges    626801.72         3.17964         3.42300         4.35100         4.60700    134052.32
Totals     626801.72         3.17964         3.42300         4.35100         4.60700    134052.32
Comment From: ShooterIT
Hi @filipecosta90 I found in _addReplyToBufferOrList (in the call chain of the reply) we added a judgement which call getClientType in #10020 , this change increases the call number of getClientType.
void _addReplyToBufferOrList(client *c, const char *s, size_t len) {
    if (c->flags & CLIENT_CLOSE_AFTER_REPLY) return;

    /* Replicas should normally not cause any writes to the reply buffer. In case a rogue replica sent a command on the
     * replication link that caused a reply to be generated we'll simply disconnect it.
     * Note this is the simplest way to check a command added a response. Replication links are used to write data but
     * not for responses, so we should normally never get here on a replica client. */
    if (getClientType(c) == CLIENT_TYPE_SLAVE) {
        sds cmdname = c->lastcmd ? c->lastcmd->fullname : NULL;
        logInvalidUseAndFreeClientAsync(c, "Replica generated a reply to command '%s'",
                                        cmdname ? cmdname : "<unknown>");
        return;
    }

    size_t reply_len = _addReplyToBuffer(c,s,len);
    if (len > reply_len) _addReplyProtoToList(c,s+reply_len,len-reply_len);
}
And i notice getClientType is inlined in your perf log, actually, i think c->flags is very hot in cache, but why it cost much?
Should we use unlikely to optimize this call, like that?
if (unlikely(getClientType(c) == CLIENT_TYPE_SLAVE))
Comment From: ShooterIT
And i think prepareClientToWrite can be optimized to reduce call clientHasPendingReplies, i said there https://github.com/redis/redis/issues/10428#issuecomment-1070924154
We can add !(c->flags & CLIENT_PENDING_WRITE) at the last judgement in prepareClientToWrite. i.e. like this
if (!(c->flags & CLIENT_PENDING_WRITE) && !clientHasPendingReplies(c) && io_threads_op == IO_THREADS_OP_IDLE)
i tried to did it, but i didn't get obvious benefit from my test. But i think we could get benefit in your test, could you test again?
Comment From: filipecosta90
And i think
prepareClientToWritecan be optimized to reduce callclientHasPendingReplies, i said there #10428 (comment)We can add
!(c->flags & CLIENT_PENDING_WRITE)at the last judgement inprepareClientToWrite. i.e. like this
c
if (!(c->flags & CLIENT_PENDING_WRITE) && !clientHasPendingReplies(c) && io_threads_op == IO_THREADS_OP_IDLE)
i tried to did it, but i didn't get obvious benefit from my test. But i think we could get benefit in your test, could you test again?
sure. Also, can't we preserve the client type info during the entire command? It seems wasteful to call this so many times for a single DB call.
Comment From: uvletter
As the most common use case for getClientType is getClientType(c) == CLIENT_TYPE_SLAVE, why not split getClientType into macro isClientTypeSlave, isClientTypeMaster and so on, to reduce the branch prediction penalty. In normal situation getClientType will go throuth three if statements, and finally hit the CLIENT_TYPE_NORMAL. I dont know how compiler or CPU try to optimize it, but by combining isClientTypeSlave with unlike, maybe we can explictly avoid the branch prediction faulure.
int getClientType(client *c) {
    if (c->flags & CLIENT_MASTER) return CLIENT_TYPE_MASTER;
    /* Even though MONITOR clients are marked as replicas, we
     * want the expose them as normal clients. */
    if ((c->flags & CLIENT_SLAVE) && !(c->flags & CLIENT_MONITOR))
        return CLIENT_TYPE_SLAVE;
    if (c->flags & CLIENT_PUBSUB) return CLIENT_TYPE_PUBSUB;
    return CLIENT_TYPE_NORMAL;
}
It's my supposition about the reason too many CPU cycles spent on getClientType()
Comment From: filipecosta90
TODO: check if adding a isClientSlave() function would improve.
Comment From: oranagra
if this function is inlined, and / or assuming the flags are in the CPU cache, i don't see why it should be slow.
two random thoughts that maybe worth looking into are:
1. try to move the flags member closer to another popular field (maybe conn or reply) to improve the chance it'll fit into a cache line.
2. we can maybe completely eliminate the need for this function if we do the necessary changes so that MONITOR will no longer be also marked as SLAVE. then all we need is c->flags & CLIENT_SLAVE and there's no need for this function to exist.
Comment From: ShooterIT
Hello @filipecosta90 do you have progress
Comment From: filipecosta90
Hello @filipecosta90 do you have progress
@ShooterIT I'm checking the suggestions above and replying back with data.
Comment From: filipecosta90
Hello @filipecosta90 do you have progress
@ShooterIT I've followed @oranagra 's recommendation in #10697 and it fixed the regression.
Comment From: oranagra
having hard time to decide if i should be happy or sad...