With the new slotToKey struct, it is possible to start tracking some metrics, such as memory usage (key size + value size but not counting fragmentation) and keyspace_hits, at the slot level. I can see this information being useful for an application to understand the skew in its workload. I wonder what is the best way to expose these metrics? Should it be part INFO or CLUSTER INFO, which would make the output explode though? Or should it be exposed via a new cluster command, CLUSTER GETSLOTINFO <slot_number_1> <slot_number_2> ... <slot_number_n> perhaps? @zuiderkwast @madolson what are your thoughts?
Originally posted by @PingXie in https://github.com/redis/redis/discussions/10411
Comment From: madolson
My suggested implementation details is:
CLUSTER GETSLOTINFO [SLOTS slot [slot ...]]
* Adding the SLOTs token makes sure the API isn't constrained, and we could add flags in the future. The slots token treats all future arguments as a slot.
* It might be useful to add a sort filter, to say, get me the "hottest" slot across the following dimension.
The initial output will include the 6 fields: * Key count: Trivial, this is just the number of keys in the slot. * Key hits: The number of key hits to a given slot. * Key misses: The number of key misses to a given slot. * CPU usage: This is the amount of CPU cycles spent on command executing within a slot, used for determining which is the hottest slot. This is pretty straight forward to calculate, now that we have the slot ID on the client struct. This will be server side resource usage. * Memory Usage: The total amount of memory used for keys/values within a slot. Someone from AWS will propose a design here, since this is a bit more involved of work to implement. * Network bytes: This is also a bit more involved, and we're still investigating a design for this.
We believe these are the primary 6 dimensions in which users are scaling clusters, so we want to provide at least this set. Other metrics are welcome!
The output of the API will be a map of slots mapped to a map of informational fields.
1) 12678 (integer)
2) 1) count
   2) 5
   3) memory_usage
   4) 150394
   3) memory_usage
   4) 150394
...
3. 12679 (integer)
4. 1) 1) count
   2) 5
   3) memory_usage
   4) 150394
   3) memory_usage
   4) 150394
Comment From: PingXie
@madolson, this initial slot metrics set make sense to me. What do you think about the importing/migrating states for a slot?
For input, I like both the SLOTS token and filtering ideas. I think we could consider generalizing the filtering support. The various metrics are essentially columns in a database or spreadsheet table so ideally we should be able to sort the table by any dimension. A key use case that I can think of is to ask a node to tell me the top N slot sorted by a given metric (desc/asc). For instance, the user would be interested in knowing the top 5 slots that use the most memory (or CPU/network bandwitdh/etc) so a query might look like the following
CLUSTER GETSLOTINFO SLOTCOUNT 5 ORDERBY memory_usage DESC
So combining with the original use case, the new command could take the following form?
CLUSTER GETSLOTINFO [SLOTCOUNT n | SLOTS s1 [s2 [s3 ...]]] [ORDERBY m [ASC|DESC]]
Both SLOTCOUNT and SLOTS are optional. When they are absent, the command returns info about all the slots hosted on the node in the order specified.
Comment From: kyle-yh-kim
Extending on @madolson‘s comment, we (AWS) would like to gain open source community's feedback on our proposed design for tracking per-slot memory usage.
This problem can be broken down into two parts;
- Track accurate memory usage of Redis key-value entry.
- Aggregate memory usage at per-slot level, given that we can track each Redis key-value entry’s memory usage.
To handle the first component, we plan on introducing a size parameter of type size_t for data-structures that are not contiguous in-memory (thus, we can’t track it’s memory through zmalloc_size). We may refer to these data-structures as memory “sparse” data-structure.
| memory sparse data-structures | memory contiguous data-structures |
|---|---|
| dict | listpack |
| rax | ziplist |
| quicklist | intset |
| zskiplist | sds |
For sparse data structures, its mutative commands can keep track of its own size parameter. This will allow the size parameter to always provide the most up-to-date memory usage. For example, hashDictType will be modified to;
// new helper function for getting the size of memory contiguous objects.
size_t dictMallocSize(const void *obj, int includeDictEntrySize) {
    if (!obj) {
        return 0;
    }
    size_t size = sdsAllocSize((char*)obj);
    if (includeDictEntrySize) {
        size += sizeof(struct dictEntry);
    }
    return size;
}

// dict.h L:79
typedef struct dict {
    dictType *type;

    dictEntry **ht_table[2];
    unsigned long ht_used[2];

    long rehashidx; /* rehashing not in progress if rehashidx == -1 */

    /* Keep small vars at end for optimal (minimal) struct padding */
    int16_t pauserehash; /* If >0 rehashing is paused (<0 indicates coding error) */
    signed char ht_size_exp[2]; /* exponent of size. (size = 1<<exp) */

    size_t size; // NEW, size parameter
} dict;

// server.c L:459
dictType hashDictType = {
    dictSdsHash,                /* hash function */
    NULL,                       /* key dup */
    NULL,                       /* val dup */
    dictSdsKeyCompare,          /* key compare */
    dictSdsDestructor,          /* key destructor */
    dictSdsDestructor,          /* val destructor */
    NULL,                       /* allow to expand */
    dictMallocSize              // NEW, size function used to obtain memory usage
};

// server.h L:459
#define dictSetKey(d, entry, key) do { \
    if ((d)→type→keyDup) \
        (entry)→key = (d)→type→keyDup((d)→privdata, key); \
    else \
        (entry)→key = (key); \
    if ((d)→type→size) { \ // NEW, if size function exists, then increment its size parameter using the size function.
        (d)→size += (d)→type→size(key, 0); \
    } \
} while(0)
To aggregate the size changes at per-slot level, each Redis mutative command can simply take the object’s size before and after its execution. If object doesn’t exist beforehand, the before size can be substituted as 0. Vice versa for object deletion. The difference in size is then accumulated within the slots_memory_usage array (index: slot number, value: memory usage).
// cluster.h
#define CLUSTER_SLOTS 16384
...
typedef struct clusterState {
    ...
    // new, definition of slots_memory_usage array.
    size_t slots_memory_usage[CLUSTER_SLOTS];
} clusterState;
The aggregation and calculation of object size before and after mutation can occur at t_datastructure.c level. We can not perform this at server.c call() level, as call() is unaware of the affected key and values. The affects keys and values depend on command implementation, such as MSET, HSET ... etc.
Aggregation example of mutation command HSET <key> <field> <value> below;
// new helper function. objectComputeSize can also be refactored to use below logic.
size_t getSizeHelper(dictEntry *de) {
    if (!de) return 0;

    size_t size = 0;
    robj *o = dictGetVal(de);
    if (isObjContiguous(o->encoding)) {
        // we will have custom size calculation for each encoding type,
        // this is just to show the general difference between in obtaining size of contiguous and sparse data-structure.
        size += zmalloc_size(o->ptr);
    } else if (isObjSparse(o->encoding)) {
        if (o->encoding == OBJ_ENCODING_HT) {
            size += ((dict *)o->ptr)->size; // since the object is sparse, we refer to its newly introduced "size" parameter.
        } else if (...) {
            ...
        }
        ...
    }
    return size;
}

// t_hash.c L:437
robj *hashTypeLookupWriteOrCreate(client *c, robj *key) {
    robj *o = lookupKeyWrite(c->db,key);
    if (checkType(c,o,OBJ_HASH)) return NULL;

    if (o == NULL) {
        o = createHashObject();

        // since this is a new entry, include its key size to the slots_memory_usage array
        // this logic can also be delegated to db.c
        server.cluster->slots_memory_usage[c->slot] += sdsZmallocSize(key->ptr);

        dbAdd(c->db,key,o);
    }
    return o;
}

// t_hash.c L:609
void hsetCommand(client *c) {
    ...
    if ((o = hashTypeLookupWriteOrCreate(c,c->argv[1])) == NULL) return;

    ...
    // get the size before mutation
    redisDb *db = c->db;
    robj *key = c->argv[1];
    size_t size_before = getSizeHelper(dictFind(db->dict,key->ptr));

    // mutation
    for (i = 2; i < c->argc; i += 2)
        created += !hashTypeSet(o,c->argv[i]->ptr,c->argv[i+1]->ptr,HASH_SET_COPY);

    // get the size after mutation, then update the size diff
    size_t size_after = getSizeHelper(dictFind(db->dict,key->ptr));
    server.cluster->slots_memory_usage[c->slot] = server.cluster->slots_memory_usage[c->slot] + size_after - size_before
}}
The added logic can also be extended to provide greater accuracy in MEMORY USAGE <KEY> command, which internally refers to objectComputeSize() within object.c.
Regarding Redis module support, the following items can be noted.
- Non data-structure modules will not be impacted.
- Data-structure modules can be supported, but the size handling needs to be implemented within the module’s source code. Below would be required for data-structure modules moving forward;
size_t sizeparameter.- Tracking of its size parameter upon its mutation commands (i.e.
JSON.SET,JSON.DEL,JSON.NUMINCRBY)
To improve backward compatibility, we can allow the modules to opt-in and out of the size calculation, and document module compatibility accordingly within the GETSLOTINFO command page.
For opt-in modules, they will be required to track its value size, and call a newly introduced hook RM_ModuleUpdateMemorySlotStats upon its mutation, to signal redis-server to register the memory size gain / loss from the module’s mutative operation.
The hook will be defined under module.c, and will look similar to;
// module.c
void RM_ModuleUpdateMemorySlotStats(RedisModuleKey *key, long size){
    int slot_numb = getSlotNumbFromKey(key->key);
    server.cluster->slots_memory_usage[slot_numb] += size;
}
The mem_usage() callback function can also be leveraged to support modules. Either way, this is to show that module compatibility is achievable.
Comment From: madolson
Just for completeness, I think the main counter point for tracking memory usage is that we could do all the work to do the book keeping based off of Zmalloc. We could do something like "set_allocation_context()" which sets global variables which are incremented and decremented when we do an allocation. It requires us to pay a lot of attention to the details, but we could probably have ~3 contexts: 1. Overhead (global structures, pretty much fixed costs) 2. Buffers (IO and disk based based buffers) 3. Everything else (Aka data stored for data structures).
I'm still a fan of the current suggested approach of having an O(1) for memory usage because of it's benefit for making it easier for us to keep track of memory for objects. It synergizes with some other efforts as well.
@madolson, this initial slot metrics set make sense to me. What do you think about the importing/migrating states for a slot?
That's a good point, it's probably worth including that information so that users can understand the state.
I think the other comments about filtering are reasonable.
Comment From: PingXie
To handle the first component, we plan on introducing a size parameter of type size_t for data-structures that are not contiguous in-memory (thus, we can’t track it’s memory through zmalloc_size). We may refer to these data-structures as memory “sparse” data-structure.
This seems like quite some plumbing work to me. I like @madolson's "allocation context" idea and I wonder if a simpler approach like the below would work
- introduce a thread-local-storage variable called _active_slot or _active_client and expose this variable to zmalloc.c
- have the
callfunction populate this TLS variable right before invokingc->cmd->procand clear it after the call. - zmalloc/zfree can then update the per-slot memory usage using the TLS variable; of course, zmalloc.c needs to have access to the global
slots_memory_usagevariable too.
The dependency from zmalloc.c to cluster.h does seem a bit awkward so we might want to consider introducing a new file called stats.h and moving slots_memory_usage out of cluster.h and into stats.h.
module backward compatibility
I think opt-in is fine. Can we also consider some indication in the output that the slot memory usage could be off due to the presence of such a module? A different stat name, memory_usage* perhaps?
Comment From: kyle-yh-kim
@PingXie It's a valid point you raised. We have previously reviewed this approach during our internal design review process, with details attached below.
TLDR; Our proposed design candidate still stands with Option 2. Size parameter introduction. That being said, we should make the right decision for open-source Redis, and would like to hear your thoughts and feedback following the pros and cons comparison attached below.
Option 1. Thread-local-storage variable introduction, followed by zmalloc aggregation based on the slot_number thread variable
The idea here is to use a thread-local-storage variable, say slot_number. This variable is then set to a relevant slot value when zmalloc requires slot metrics aggregation, and vice versa set to NULL to omit aggregation of memory allocations irrelevant to customer key-space (including but are not limited to; 1. Transient / temporary 2. Redis administration 3. Client input / output buffer).
Example zmalloc.c code snippet attached below;
#define update_zmalloc_stat_alloc(__n) do { \
    atomicIncr(used_memory,(__n)); \
    if (slot_number) { \
        slot_memory_usage[slot_number] += (__n); \
    } \
} while(0)

#define update_zmalloc_stat_free(__n) do { \
    atomicDecr(used_memory,(__n)); \
    if (slot_number) { \
        slot_memory_usage[slot_number] -= (__n); \
    } \
} while (0)
Pros
- Performant, per-slot memory array is updated upon mutation. The cost of building slot metrics is amortized (spread across) mutative commands.
- Accurate. Slot metrics array is updated per every zmalloc associated with customer key-space memory allocation.
- However, the full reliance of zmalloc also becomes a pain point in maintenance, which we will discuss within the cons section.
Cons
Overall, the cons of this design candidate stems from one characteristic: zmalloc is used frequently across all depths of Redis mutative commands' call-stack.
- Maintenance and hard-to-follow logic. At first glance, this approach seems simplistic to implement. However, zmalloc context switching from customer key-space to others intents (including but are not limited to; 1. Transient / temporary 2. Redis administration 3. Client input / output buffer) can occur throughout all depths of Redis mutative command call-stack. Out of all zmalloc operations, we must isolate those relevant to customer key-space. Thus, for every mutative Redis command, we must first completely map-out these context switching windows, followed by its maintenance upon any new zmalloc introduction within these windows.
- The 2nd candidate solves this maintenance problem by logically separating all size tracking within the memory sparse internal data-structure files, such as
rax.c,dict.c,quicklist.cand so on. The size tracking will not creep into other depths of call-stacks. - Down the road, if any bug is introduced, 1st candidate will require sweeping across all zmalloc operations within all depths of call-stacks. For the 2nd candidate, we may simply refer to the specific internal data-structure file.
- The 2nd candidate solves this maintenance problem by logically separating all size tracking within the memory sparse internal data-structure files, such as
- Complex and invasive, as zmalloc can not be relied under all cases.
- For example, in order to get the relevant slot number, the input must first be parsed. However, parsing of this input requires zmalloc. We now run into a cyclic dependency, where zmalloc needs slot number to increment, but the slot number can only be obtained once key is parsed through zmalloc. To mitigate, we may temporarily save the size of these variables, then increment them once the slot number is parsed and request is successful. But now, we need a way to carry this additional temporary variable, either through another global variable, or additional argument across all call-stacks.
- Another example would be,
robj valueare conditionally re-created following the initial parsing (createStringObjectFromLongLongWithOptions()). So then, the size of the initially parsed value may or may not be disregarded from the slot metrics array. This requires another layer of consideration. - After a few edge case considerations, the implementation touches multiple signatures and growing number of global variables.
Option 2. Size parameter introduction within memory sparse internal data-structures.
This option breaks down the per slot memory metrics into two sub-problems. 1. Track accurate memory usage of Redis key-value entry. 2. Aggregate memory usage at per-slot level, given that we can track each Redis key-value entry’s memory usage.
To track accurate memory usage of Redis key-value entry, Redis is introduced with a size parameter of type size_t for data-structures that are not contiguous in-memory (thus, we can’t track it’s memory through zmalloc_size). We may refer to these data-structures as memory “sparse” data-structure.
| memory sparse data-structures | memory contiguous data-structures |
|---|---|
| dict | listpack |
| rax | ziplist |
| quicklist | intset |
| zskiplist | sds |
For sparse data structures, its mutative commands can keep track of its own size parameter. This will allow the size parameter to always provide the most up-to-date memory usage.
To aggregate the size changes at per-slot level, Redis mutative command can simply take the object’s size before and after its execution. If object doesn’t exist beforehand, the before size can be substituted as 0. Vice versa for object deletion. The difference in size is then accumulated within the slots_memory_usage array (index: slot number, value: memory usage).
For more details, our previous comment can be referred.
Pros
- Performant, per-slot memory array is updated upon mutation. The cost of building slot metrics is amortized (spread across) mutative commands.
- Accurate. Slot metrics array is updated by referring to the
zmalloc_size()for memory contiguous data-structure, andvar->sizefor memory sparse data-structure (wherevar->sizeis built by memory contiguous data-structure, where its size can be obtained throughzmalloc_size()), before and after each mutative command. - Better maintenance. It will be easier to follow than the option 1 counter-part, as all size tracking is contained within internal data-structure files, such as
rax.c,dict.c,quicklist.cand so on. As well, all slot level aggregation will be contained withint_datastructure.canddb.clevel. Maintainers will not have to look elsewhere. - Bonus: Redis can now provide a more performant and accurate
MEMORY USAGE <key>command result, as this solution keeps track of memory usage at key-value granularity.- This will benefit data-structures like
Hash, whereHSETcommand can mutate a value without changing the length of dictionary. The current implementation ofMEMORY USAGE <key>won't report any difference if the mutation does not occur within the first 5 sampling window.
- This will benefit data-structures like
Cons
To say that the 2nd design candidate is perfect would be far from the truth. Everything is a trade-off in the end. Below are notable cons of the 2nd design candidate.
- Introduction of
size_t sizeparameter for memory sparse internal data-structures increases the memory overhead of Redis. Below outlines the additional memory overhead stemming from this change.- Fixed memory overhead. This value does not grow linearly to the # of customer key space.
131,072 Bytes, from size_t slots_memory_usage[CLUSTER_SLOTS];Keep in mind, this overhead exists for both options, as both require slot metrics array to store memory usage per slot information. - Variable memory overhead. This value grows linearly to the # of customer key space.
16*(#sparse_Sets) + 16*(#sparse_Hashes) + 8*(#sparse_Lists) + 24*(#sparse_SortedSets) + 8*(#streams) + 8*(#streamConsumerGroups) + 8*(#streamConsumers) BytesThe word "sparse" refer to those data-types using sparse internal data-structure. For example,Hashdata-type usingziplistwill not be consideredsparse_Hashes. Only its "sparse" version ofdictcounterpart will contribute to the additional memory overhead.
- Fixed memory overhead. This value does not grow linearly to the # of customer key space.
- Invasive change. Introducing a self-tracking size parameter is still considered invasive. However, on the good note, these changes are contained within their associated data-structure files. No changes will creep into other depths of Redis mutative commands' call-stack.
Comment From: kyle-yh-kim
Can we also consider some indication in the output that the slot memory usage could be off due to the presence of such a module? A different stat name, memory_usage* perhaps?
@PingXie For sure, it's a good idea to differentiate / alarm Redis users when their per slot memory metrics are impacted by un-supported module presence.
We will get back on this after closing the major design decision convergence, posted above.
Comment From: madolson
Related to https://github.com/redis/redis/pull/10152
Comment From: madolson
@oranagra @redis/core-team Thoughts about https://github.com/redis/redis/issues/10472#issuecomment-1138070198 ? The idea is that there should be an O(1) way for getting the allocated size for all data structures in Redis. The dense structures (string,listpack,etc) are pretty easy to infer, but the sparse structures (hashmap, rax) will require additional memory tracking.
The use case is that we can can then have a realtime tracking for the memory usage per slot (or other primitives like database/datatype) based on changes in memory for the value. If the value is updated, we can update the per slot memory by the difference between the new_memory - initial_memory. We at AWS have had issues determining heat during balancing. It's trivial to figure out the node heat, but it's not always trivial to figure out how to shed the load, since a naive split may not help.
It's a significant investment into the core to update all of the locations where we have to track the memory, and the sparse data structures will have a small memory overhead.
It also provides the minor benefit of memory usage to be O(1) and precise. It will need some type of module API hook.
Comment From: PingXie
Thanks for the detailed write-up, @kyle-yh-kim.
With your explanation, the biggest downside to me with the TLS idea is the challenge to filter out temporary memory allocations whose life cycle goes beyond the command invocation (as denoted by c->cmd->process(c)) and as you mentioned, client query/output buffers are two great examples. I don't see a cleaner solution either so I agree option 1 is out.
10512 is a good read. I think we will likely see a similar latency impact on the "write" path when it comes to those "sparse" data structures with your option 2. This plus the additional memory overhead can be a concern for some customers. For clusters, I think the overhead is more justified because the additional metrics would benefit the customers as they can now scale out their clusters with more accuracy and confidence. The value however might not be that obvious for non-cluster users. For one, there is no slot in a non-cluster Redis instance; for two, unless there is a client-side sharding solution, I am not sure how actionable knowing the largest N keys is? So I wonder if it is possible to make this memory tracking an opt-in feature, leaving out the size update logic at the minimum. Saving the overhead introduced by the "size" field would be harder. Not sure if it makes any sense to use an out-of-band dict to map the obj pointer (8 bytes) to a size field (8 bytes)? This, though, would penalize the cluster user more with 2x memory overhead and more hops/cache-misses when updating the sizes. We could see an even worse latency impact than reported in #10512.
Side question.
Variable memory overhead. This value grows linearly to the # of customer key space. 16(#sparse_Sets) + 16(#sparse_Hashes) + 8(#sparse_Lists) + 24(#sparse_SortedSets) + 8(#streams) + 8(#streamConsumerGroups) + 8*(#streamConsumers) Bytes
I am curious to know why there are different factors (such as 16 for sets, 8 for lists, etc). I thought that your plan is to add a single 8-byte size field to each instance of these sparse structures? Where do the extra bytes come from?
It also provides the minor benefit of memory usage to be O(1) and precise.
Agreed that MEMORY USAGE <key> being O(1) and precise is very nice. If somehow we could also compute the payload size, which is essentially key_size + value_size + some overhead, in O(1) (assuming no compression) on the slot migration path, we could build the RESTORE payload directly in the cmd buffer and avoid the memcpy. I am referring to migrateCommand calling createDumpPayload and then memcpy'ing the payload into cmd.
Comment From: madolson
I am curious to know why there are different factors (such as 16 for sets, 8 for lists, etc). I thought that your plan is to add a single 8-byte size field to each instance of these sparse structures? Where do the extra bytes come from?
It's apparently related to jemalloc arena sizes, which don't always allocate in sizes of 8. There are ways to get around this though that we can investigate, there might be other places we can optimize to reduce the memory usage.
I'm not sure why the sparse hashes/sets require 16 bytes though.
Agreed that MEMORY USAGE
being O(1) and precise is very nice. If somehow we could also compute the payload size, which is essentially key_size + value_size + some overhead, in O(1) (assuming no compression) on the slot migration path, we could build the RESTORE payload directly in the cmd buffer and avoid the memcpy. I am referring to migrateCommand calling createDumpPayload and then memcpy'ing the payload into cmd.
Even if we were able to achieve this for some of the types this would be a great win as well!
Comment From: kyle-yh-kim
It's been a while since the last update was posted!
Here's our update thus far - Based on open-source community's interests, we have been investing time & efforts into performance benchmarking, to understand the performance impact of the currently proposed changes.
We are using the following testing strategies.
- Latency & TPS, worst-case workload
- Input:
- 1 target EC2 instance (acting as target running
redis-server) - 8 client EC2 instances (acting as a client, each running
redis-benchmark) - 400 Redis clients total (50 clients per EC2 instance)
- 0:100 R/W ratio. For both cluster mode enabled / disabled.
- Generic mutative command for all data-types (String, Hash, Set, List, Geo, SortedSet, Stream)
- 1 target EC2 instance (acting as target running
- Output:
- p50, p90, p99 latency, TPS
- Q: Why is this the worst case? This is the case as the proposed change only require additional computation upon write commands. Read commands are unaffected.
- Q: Why are we testing for cluster mode disabled? Since cluster mode disabled still undergoes accurate memory allocation tracking per data-type, it will incur additional computational overhead.
- Input:
- Latency & TPS, average-case workload
- Input:
- 1 target EC2 instance (acting as target running
redis-server) - 8 client EC2 instances (acting as a client, each running
redis-benchmark) - 400 Redis clients total (50 clients per EC2 instance)
- 80:20 R/W ratio. For both cluster mode enabled / disabled.
- Generic mutative command for all data-types (String, Hash, Set, List, Geo, SortedSet, Stream)
- 1 target EC2 instance (acting as target running
- Output:
- p50, p90, p99 latency, TPS
- Input:
- CPU impact
- Input: identical to above scenarios. Upon
redis-benchmarkcompletion, run;info commandstatson the target node. - Output:
usec_per_call
- Input: identical to above scenarios. Upon
The benchmark results should be available in the next week or two.
In the meantime, we'd like to hear from the open-source community on the following items.
- Are there any additional testing dimensions you would like us to incorporate? Are we missing any critical measurements?
- Are there any other design candidates, aside from the ones mentioned previously within this thread (including the currently preferred solution)?
- How often are internal data-structures introduced? Its update frequency must be weighed into quantifying the currently preferred design candidate's maintenance factor.
- What is the priority in open source Redis performance benchmarking, latency vs TPS?
Are there better alternatives? Recap: Below are the previous design candidates discussed thus far.
-
Taking
used_memorydifference, before and after command execution - link.- This was pruned due to the reasons discussed here.
-
Tracking memory allocate bytes at internal data-structure level (preferred).
- One argument against this approach would be the maintenance burden in having to introduce size tracking per internal data-structure (associated with customer data) moving forward.
- For which, a relevant question would be - how often are internal data-structures introduced? This is asked in earlier points.
I'd also like to raise a new design candidate, a complete refactoring of zmalloc.
Perhaps introducing a new atomic counter, let's call it used_memory_redisdb, in additon to the existing used_memory. This counter will be used to track memory usage strictly associated with redisDb customer data, which excludes memory allocations related to temporary, COB, and redis administrative variables.
After, simply taking the difference of used_memory_redisdb before and after write command, can be accumulated under slot_metrics array.
This would however, require a thorough deep-dive across all zmalloc use cases. Every zmalloc, zrealloc, and zfree calls will have to be categorized according to their intention, then only the ones associated with redisDb customer data will require an update in its input argument or a new function call, depending on its implementation.
Overall, this would require a lot of initial fixed engineering effort, but still worth investigating. Perhaps "a lot" is an understatement, given how frequently zmalloc, zrealloc, and zfree calls are made throughout redis.
That being said - it would alleviate the maintenance burden, which is a downside to the currently preferred design candidate.
I can not speak for its performance for now, as there will be additional atomic counter updates per each zmalloc relevant to customer data modification.
Any thoughts, is this approach worth investigating, if not - what are the reasons for fast-failure ?
Comment From: madolson
@kyle-yh-kim As we talked about internally, I only think we need to be tracking TPS, which is a proxy for the execution time of individual commands on the server side. Latency is not a very precise measurement in this context.
This would however, require a thorough deep-dive across all zmalloc use cases. Every zmalloc, zrealloc, and zfree calls will have to be categorized according to their intention, then only the ones associated with redisDb customer data will require an update in its input argument / new function call, depending on the implementation.
I think this misunderstands the idea. The idea is that instead of trying to categorize each and every zmalloc call, we set the "state" of the zmalloc calls. Let's assume there is 2 states, "tracking slot memory" and "tracking global state". We are able to call some type of function that sets this state, so that all future zmalloc and zfree calls happen in that context.
Let's take a simple example of hsetCommand. During the execution of a command, the following will happen:
1. We will reply to the client, this will increment some memory, however there is a common entry point in the addReply* functions.
2. We will trigger some keyspace notifications. Again there are entry points for this code.
3. The dictionary might be rehashing. We have entry points for "lookup key" to handle this.
4. We will add memory into the hash, we will consider this as all the other memory that doesn't fall into the earlier two cases.
So, before every write function call, we will set the state to tracking slot memory. When we enter (1) or (2) functions, we will switch the state to tracking global state. Then when we exit the function, we will go back to the global state.
Comment From: kyle-yh-kim
@madolson Understood. If this is the case - isn't the "zmalloc state" approach identical to @PingXie 's proposed solution earlier, which has been pruned? His comment is attached below;
From @PingXie, May 18 This seems like quite some plumbing work to me. I like @madolson's "allocation context" idea and I wonder if a simpler approach like the below would work
introduce a thread-local-storage variable called _active_slot or _active_client and expose this variable to zmalloc.c
have the
callfunction populate this TLS variable right before invokingc->cmd->procand clear it after the call.zmalloc/zfree can then update the per-slot memory usage using the TLS variable; of course, zmalloc.c needs to have access to the global
slots_memory_usagevariable too.
And below is my response to why setting the "state" of zmalloc isn't a preferred design choice.
From @kyle-yh-kim, May 25
Pros
Performant, per-slot memory array is updated upon mutation. The cost of building slot metrics is amortized (spread across) mutative commands.
Accurate. Slot metrics array is updated per every zmalloc associated with customer key-space memory allocation.
However, the full reliance of zmalloc also becomes a pain point in maintenance, which we will discuss within the cons section.
Cons
Overall, the cons of this design candidate stems from one characteristic: zmalloc is used frequently across all depths of Redis mutative commands' call-stack.
Maintenance and hard-to-follow logic. At first glance, this approach seems simplistic to implement. However, zmalloc context switching from customer key-space to others intents (including but are not limited to; 1. Transient / temporary 2. Redis administration 3. Client input / output buffer) can occur throughout all depths of Redis mutative command call-stack. Out of all zmalloc operations, we must isolate those relevant to customer key-space. Thus, for every mutative Redis command, we must first completely map-out these context switching windows, followed by its maintenance upon any new zmalloc introduction within these windows.
- The 2nd candidate solves this maintenance problem by logically separating all size tracking within the memory sparse internal data-structure files, such as
rax.c,dict.c,quicklist.cand so on. The size tracking will not creep into other depths of call-stacks.- Down the road, if any bug is introduced, 1st candidate will require sweeping across all zmalloc operations within all depths of call-stacks. For the 2nd candidate, we may simply refer to the specific internal data-structure file.
Complex and invasive, as zmalloc can not be relied under all cases.
- For example, in order to get the relevant slot number, the input must first be parsed. However, parsing of this input requires zmalloc. We now run into a cyclic dependency, where zmalloc needs slot number to increment, but the slot number can only be obtained once key is parsed through zmalloc. To mitigate, we may temporarily save the size of these variables, then increment them once the slot number is parsed and request is successful. But now, we need a way to carry this additional temporary variable, either through another global variable, or additional argument across all call-stacks.
- Another example would be,
robj valueare conditionally re-created following the initial parsing (createStringObjectFromLongLongWithOptions()). So then, the size of the initially parsed value may or may not be disregarded from the slot metrics array. This requires another layer of consideration.- After a few edge case considerations, the implementation touches multiple signatures and growing number of global variables.
And back to PingXie, we reached the conclusion that this approach (option 1), is out for consideration.
From @PingXie, May 31 With your explanation, the biggest downside to me with the TLS idea is the challenge to filter out temporary memory allocations whose life cycle goes beyond the command invocation (as denoted by c->cmd->process(c)) and as you mentioned, client query/output buffers are two great examples. I don't see a cleaner solution either so I agree option 1 is out.
To highlight, I believe that maintenance of "zmalloc state windows" is actually a lot more difficult than it sounds, in comparison to the maintenance of size tracking per data-structure.
This is the case, since the "zmalloc state" can switch at any depth of redis call-stack. Unlike size tracking per data-structure approach, the changes are not logically isolated under data-structure files, such as rax.c, dict.c, quicklist.c. Rather, it can occur within networking,c, evict.c, lazyfree.c, db.c, and the list goes on.
For example, say a new open-source contributor wants to make a commit. At every change, the contributor will have to ask the following questions;
- "For this feature, which portion of the zmalloc state windows should be X, and which should be Y?"
- "I plan on making changes at db.c between L:000 ~ L:000, and lazyfree.c between L:000 ~ L:000."
- "What are the zmalloc state windows during these lines I am about to change?"
- "If identical, do I even need to introduce new state windows?"
The only way to answer these questions are through deep-diving the redis call-stack. If lucky, the zmalloc state will be defined +-10 lines within contributor's target change location. If not, the contributor will have to explore levels above and below the call-stack at which the change is about to be made. Again - not a maintenance friendly change.
This does not mean that the size tracking at data-structure level design candidate comes without any maintenance burden, but at least the contributor only has to worry about size tracking when data-structure level changes are made (changes are logically isolated and predictable). Meaning, contributor making changes irrelevant to data-structures will not have to worry on defining zmalloc state windows.
Hence, the earlier question of "How often are internal data-structures introduced?" would help quantify the maintenance factor of the data-structure size tracking design candidate.
If the answer to above question is "not frequent", my personal vote still stands for the size tracking per data-structure level. And as a bonus, this design candidate provides MEMORY USAGE <key> at O(1) time, with extension possibility towards TOP N hot-key analysis in the future.
That said, I would still like to hear yours & open-source community's thoughts on this. Let me know if there's any points I may have missed, or require clarifications on.
Comment From: madolson
I'm aware of both of those comments, and they aren't addressing that there are relatively easy ways to identify those other types of memory allocations. Data structures are fairly well contained in a couple of files, and if states are only really being toggled at the entrance of command functions, and we keep track of basically all of the downstream functions, a user might honestly never need add new state changes. So in your example, they wouldn't even need to think about. Basically, all memory allocated within a datastructure command will be tracked except those backlisted and excluded.
That said, I would still like to hear yours & open-source community's thoughts on this. Let me know if there's any points I may have missed, or require clarifications on.
I suppose I should clarify I'm still in favor of the approach you are outlining, I just don't think we've adequately ruled out the alternative as an option.
Comment From: madolson
@kyle-yh-kim I also don't think the used_memory_redisdb can realistically work, as there are places where zmalloc is called for both purposes. Like dict, which stores the main dictionary as well as for sets and hashes.
Comment From: madolson
@oranagra @yossigo @soloestoy @zuiderkwast Pinging some individual people this time.
The general conclusion of this thread is that in order to best track the memory used per-slot in CME, the recommended approach is to update each datastructure so that it supports an O(1) mechanism for keeping track of its memory. This mechanism would then be extended, so that each time a key is modified, the slot will be updated to check the memory of the value before and after. Given that this change will likely impact a lot of code as well as add memory overhead for some data structures to track the memory, I would like other folks to way in. https://github.com/redis/redis/issues/10472#issuecomment-1138070198 Still seems to have the most detail.
We're still working on performance benchmarks to qualify the impact is minimal.
Comment From: zuiderkwast
I have no pronlem with this. I assume the memory and CPU impact is minimal.
Comment From: kyle-yh-kim
@zuiderkwast Thanks your feedback on the design candidate. Regarding CPU impact, please refer to the performance benchmarking results below.
Notes
- Read commands (ex:
get,hget) are not impacted. This make sense, given that the changes only impact write paths. - Below scenario tests for the absolute worst case performance degradation; at 100% CPU utilization, with 100% write commands at all times. For realistic use-case scenarios of 8:2 R/W ratio, TPS degradation will be a lot less than the numbers depicted below. To obtain TPS degradation for various R/W ratios (8:2, 9:1 ... etc.), linear interpolation can be employed.
- Our study has found that at CPU utilization below 100%, neither latency nor TPS is impacted. This make sense, given that the added computation is in the microseconds scale, causing no notable difference when CPU is not stressed at 100%, and thus not processing commands at a consecutive manner. Only at 100% CPU utilization, the threads will have to work non-stop, resulting in those microseconds overhead to add-up.
Recap: What contributes to the TPS / CPU degradation?
There are two parts:
1. Size tracking at data-structure level.
- Performance degradation introduced due to size (memory usage in bytes) tracking at data-structure level. Only memory sparse data-structures cost this type of degradation, as memory contiguous data-structures already track its size, and can be accessed at O(1) time (ex: sdsZmallocSize()).
- memory sparse data-structures (incurs performance degradation): dict, rax, quicklist, zskiplist
- memory contiguous data-structures (does not incur performance degradation): listpack, ziplist, intset, sds
2. Aggregation at slot level.
- Performance degradation introduced due to capturing memory usage difference at per-slot level. Cluster mode disabled instances do not incur this type of degradation.
- As of now, two main hook points are lookupKeyWrite(), for capturing the size before mutation, and signalModifiedKey(), for capturing the size after mutation. The two values are subtracted and added accordingly upon call() completion. This incrementally builds the memory slot metrics per every write command. Other hook points are also welcomed for discussion.
0:10 R/W ratio (worst-case scenario, all write command, 100% CPU utilization), Cluster mode disabled
| TPS degradation % (cluster mode disabled) | comment (optional) | |
|---|---|---|
| get | -0% | Not impacted. |
| string (HLL, bitops, regular string) | -0% | Not impacted. String uses sds, its memory allocation bytes is already tracked by sdsZmallocSize(). |
| hash (using dict) | -0.88% | Computation cost due to dict size tracking. |
| hash (using ziplist) | -0% | Not impacted. Memory contiguous data-structures already track its size. No additional computation is required. |
| set (using dict) | -0.59% | Computation cost due to dict size tracking. |
| set (using intset) | -0% | Not impacted. Memory contiguous data-structures already track its size. No additional computation is required. |
| list | -0.86% | Computation cost due to quicklist size tracking. |
| sortedset/geospatial (using zskiplist & dict) | -1.16% | sortedset/geospatial exhibits the greatest relative degradation, due to its underlying implementation in using not only one but two memory-sparse data-structures; zskiplist and dict. This incurs degradation from both zskiplist and dict data-structure level size tracking. |
| sortedset/geospatial (using ziplist) | -0% | Not impacted. Memory contiguous data-structures already track its size. No additional computation is required. |
| stream | -0.35% | Computation cost due to stream size tracking. |
0:10 R/W ratio (worst-case scenario, all write command, 100% CPU utilization), Cluster mode enabled
| TPS degradation % (cluster mode enabled) | comment (optional) | |
|---|---|---|
| get | N/A | Not impacted. |
| string (HLL, bitops, regular string) | -0.64% | This degradation stems purely from slot metrics aggregation. As stated previously, String uses sds, its memory allocation bytes is already tracked by sdsZmallocSize(), resulting in no additional computation in data-structure size tracking. |
| hash (using dict) | -1.85% | Computation costs due to dict size tracking, and memory aggregation at per-slot level. |
| hash (using ziplist) | N/A, please refer to the comments | Identical to string, degradation stems purely from slot metrics aggregation. Similar degradation % can be expected to that of String (-0.64%). |
| set (using dict) | -1.00% | Computation costs due to dict size tracking, and memory aggregation at per-slot level. |
| set (using intset) | N/A, please refer to the comments | Identical to string, degradation stems purely from slot metrics aggregation. Similar degradation % can be expected to that of String (-0.64%). |
| list | -1.77% | Computation costs due to; quicklist size tracking, and memory aggregation at per-slot level. |
| sortedset/geospatial (using zskiplist & dict) | -2.62% | Aligning with the cluster mode disabled results, sortedset/geospatial exhibits the greatest relative degradation, due to its underlying implementation in using not only one but two memory-sparse data-structures; zskiplist and dict. This incurs degradation from both zskiplist and dict data-structure level size tracking. In addition, slot metrics memory aggregation is added. |
| sortedset/geospatial (using ziplist) | N/A, please refer to the comments | Identical to string, degradation stems purely from slot metrics aggregation. Similar degradation % can be expected to that of String (-0.64%). |
| stream | -0.57% | Computation costs due to stream size tracking, and memory aggregation at per-slot level. |
Moving forward from the theoretical worst-case at 0:10 R/W ratio (all write command), below are linearly interpolated results for 8:2 R/W ratio, providing a more reasonable TPS impact given average workload.
8:2 R/W ratio (100% CPU utilization), Cluster mode disabled
| TPS degradation % (cluster mode disabled) | comment (optional) | |
|---|---|---|
| get | -0% | Below values are linearly interpolated from the theoretical worst-case results, at 0:10 R/W ratio, all write commands. |
| string (HLL, bitops, regular string) | -0% | |
| hash (using dict) | -0.18% | |
| hash (using ziplist) | -0% | |
| set (using dict) | -0.12% | |
| set (using intset) | -0% | |
| list | -0.17% | |
| sortedset/geospatial (using zskiplist & dict) | -0.23% | |
| sortedset/geospatial (using ziplist) | -0% | |
| stream | -0.07% |
8:2 R/W ratio (100% CPU utilization), Cluster mode enabled
| TPS degradation % (cluster mode enabled) | comment (optional) | |
|---|---|---|
| get | -0% | Below values are linearly interpolated from the theoretical worst-case results, at 0:10 R/W ratio, all write commands. |
| string (HLL, bitops, regular string) | -0.13% | |
| hash (using dict) | -0.37% | |
| hash (using ziplist) | N/A, please refer to the comments | Identical to string, degradation stems purely from slot metrics aggregation. Similar degradation % can be expected to that of String (-0.13%). |
| set (using dict) | -0.23% | |
| set (using intset) | N/A, please refer to the comments | Identical to string, degradation stems purely from slot metrics aggregation. Similar degradation % can be expected to that of String (-0.13%). |
| list | -0.35% | |
| sortedset/geospatial (using zskiplist & dict) | -0.52% | |
| sortedset/geospatial (using ziplist) | N/A, please refer to the comments | Identical to string, degradation stems purely from slot metrics aggregation. Similar degradation % can be expected to that of String (-0.13%). |
| stream | -0.11% |
Comment From: kyle-yh-kim
Aside from CPU / TPS impact, memory overhead has been noted down within my previous comment here.
Introduction of
size_t sizeparameter for memory sparse internal data-structures increases the memory overhead of Redis. Below outlines the additional memory overhead stemming from this change.
Fixed memory overhead. This value does not grow linearly to the # of customer key space.
131,072 Bytes, from size_t slots_memory_usage[CLUSTER_SLOTS];Keep in mind, this overhead exists for both options, as both require slot metrics array to store memory usage per slot information.Variable memory overhead. This value grows linearly to the # of customer key space.
16*(#sparse_Sets) + 16*(#sparse_Hashes) + 8*(#sparse_Lists) + 24*(#sparse_SortedSets) + 8*(#streams) + 8*(#streamConsumerGroups) + 8*(#streamConsumers) BytesThe word "sparse" refer to those data-types using sparse internal data-structure. For example,Hashdata-type usingziplistwill not be consideredsparse_Hashes. Only its "sparse" version ofdictcounterpart will contribute to the additional memory overhead.
Comment From: madolson
@kyle-yh-kim Did you run any tests where CME was enabled but metrics collection was disabled? I presume the performance would then be equivalent to the CMD case.
I also want to summarize the impact more concisely for review. We only care about write performance, so I just want to focus on the 100% write workload. I also think the impact for individuals not using this feature is more significant than those that are opting out of the feature.
When running with any configuration, the following extra memory will be used and will see up to the following performance impact: | Data structure | Memory impact | Performance Impact | | -------- | ------ | ----- | | Sorted sets (Hashmap encoding) | 24 extra bytes | ~1.15% write performance impact | | Hashes (Hashmap encoding) | 16 extra bytes | ~0.9% write performance impact. | | Sets (hashmap encoding) | 16 extra bytes | ~0.6% write performance impact. | | Lists | 8 extra bytes | ~0.9% write performance impact. | | Streams | 8-24 extra bytes | ~0.35% write performance impact. |
All other data types are not meaningfully impacted. There is an additional impact based on the command when enabling actual key/value tracking.
Comment From: kyle-yh-kim
@madolson That's correct. In fact, the relative performance hit would be slightly better than CMD case. Reason being, CME has a few additional computation related to clusters, which dilutes the TPS degradation to be less.
Comment From: madolson
Update from an internal core notes: * Performance generally looks ok * Memory usage is hard to follow. We want to review an updated memory impact highlighting the potential worst cases.
Comment From: kyle-yh-kim
Here's the summary of the worst-case memory impact, along with its reasonable counter-parts.
Please note, while the % may suggest worst-case memory impact being detrimental, the absolute memory difference will never change (8~24 extra bytes per memory sparse data-structure). The extra memory percentage is decreased as more elements are added to the key, as it is a fixed value.
While only the worst-case impact was requested, I've also attached its reasonable variants, as the theoretical worst-case require the following explicit conditions to be met. - User inserts one element, with its size just enough to trigger memory dense to memory sparse data-structure conversion to occur (ex: ziplist --> zskiplist, dict). - User never inserts elements after, and only holds one element within the data-type.
| data-type | theoretical worst case (1 element) | reasonable load (10 elements) | reasonable load (100 elements) |
|---|---|---|---|
| String | 0% | 0% | 0% |
| Hash | 5.6% | 1.1% | 0.13% |
| Set | 7.9% | 2.8% | 0.38% |
| SortedSet | 2.4% | 1.0% | 0.14% |
| List | 4.9% | 3.1% | 0.68% |
Unfortunately a perfect solution does not exist, and hence, details are noted here to discuss each design candidate's trade-offs. I'm also open to hearing alternative design candidates, excluding the zmalloc approach which has already been pruned here.
Further details on deriving above numbers are attached below.
SDS based data-types (String, Hyperloglog, Bitmaps)
There is no memory impact, as we can refer to sdsZmallocSize() for its memory consumption.
Hash
The minimum requirement for hash data-type to convert from ziplist to dict encoding is either;
1. number of elements greater than hash-max-ziplist-entries (default: 512), or
2. value to be greater than hash-max-ziplist-value (default: 64)
For case 1:
for 0 < i < 512 {
    HSET test field_i value_i
}

For case 2:
HSET test field_i {string with char length 65, to trigger the >64 ziplist conversion}
Using a modified version of the objectComputeSize(), to iterate over the entire data-type, instead of the first 5 sampling window, below numbers can be noted.
For case 1, 16/28889 --> 0.055% For case 2, with 1 element, 16/282 --> 5.6%
While the case 2 number is high, this is for the absolute worst-case, where the user only holds one item inside the hash, with the element size just enough to convert from ziplist to dict, and nothing more. The % difference is diluted as more elements are added into the hash.
For case 2, with 10 items, 16/1362 --> 1.1% For case 2, with 100 items, 16/12162 --> 0.13%
Set
The minimum requirement for set data-type to convert from intset to dict encoding is either;
1. number of integer type elements greater than set-max-intset-entries (default: 512), or
2. number of non-integer type elements greater than 1
For case 1:
for 0 < i < 512 {
    SADD test i
}

For case 2:
SADD test value_i
Using a modified version of the objectComputeSize(), to iterate over the entire data-type, instead of the first 5 sampling window, below numbers can be noted.
For case 1, 16/20681 --> 0.077% For case 2, with 1 element, 16/202 --> 7.9%
While the case 2 number is high, this is for the absolute worst-case, where the user only holds one item inside the set, and nothing more. The % difference is diluted as more elements are added into the set.
For case 2, with 10 items, 16/562 --> 2.8% For case 2, with 100 items, 16/4162 --> 0.38%
SortedSet / Geospatial
The minimum requirement for hash data-type to convert from ziplist to zskiplist encoding is either;
1. number of elements greater than zset-max-ziplist-entries (default: 128), or
2. value to be greater than zset-max-ziplist-value (default: 64)
For case 1:
for 0 < i < 128 {
    ZADD test i "string_i"
}

For case 2:
ZADD test i {string with char length 65, to trigger the >64 ziplist conversion}
Using a modified version of the objectComputeSize(), to iterate over the entire data-type, instead of the first 5 sampling window, below numbers can be noted.
For case 1, 24/12753 --> 0.18% For case 2, with 1 element, 24/993 --> 2.4%
While the case 2 number is high, this is for the absolute worst-case, where the user only holds one item inside the sortedset, with the element size just enough to convert from ziplist to zskiplist, and nothing more. The % difference is diluted as more elements are added into the sortedset.
For case 2, with 10 items, 24/2394 --> 1.0% For case 2, with 100 items, 24/16786 --> 0.14%
List
List has only quicklist encoding available (older versions seem to have supported ziplist, which gets restored as quicklist upon RDB load).
LPUSH test value_i
Using a modified version of the objectComputeSize(), to iterate over the entire data-type, instead of the first 5 sampling window, below numbers can be noted.
List, with 1 item, 8/162 --> 4.9%
While the number is high, this is for the absolute worst-case, where the user only holds one item inside the list, and nothing more. The % difference is diluted as more elements are added into the list.
List, with 10 items, 8/258 --> 3.1% List, with 100 items, 8/1170 --> 0.68%
Comment From: madolson
Thanks for this data @kyle-yh-kim. Overall this data seems really good to me. There is the separate project for improving main memory efficiency of the dictionary, so if these two features are released together it might not be noticeable.
One thing that strikes me is that we never have built the dense encodings for lists or sets that have been discussed in the past. @oranagra do you still have concerns about memory usage?
Comment From: oranagra
for the record, i'm not sure the absolute worse case, and the reasonable one are so far apart. it could be that the object has one big field, and another 2 that are short (not 10 long ones).
I usually try to remind myself that the dense encodings are about memory and not about speed (so it's ok to slow them down), maybe we can say the opposite too, i.e. that the sparse encodings are about speed and it's ok to make them bigger? i'm still a bit uncomfortable to do that since we spend a lot of memory just on introspection. why are some data structures consume an extra 24 bytes? is that because of struct padding and internal fragmentation? maybe we can somehow improve by changing the layout?
btw, lists do have dense encoding (quicklist is an evolution of both linked-list and ziplist, should have the best of both worlds). for sets, we have the intset, and indeed we don't have a dense encoding in case the set is non-integer.
Comment From: kyle-yh-kim
The following is the breakdown of each data-structure's extra memory consumption.
Hash & Set (using dict), 16 bytes
From dict, total of 16 bytes.
- 8 bytes from dict->size_t alloc_bytes
- 8 bytes from hashDictType / setDictType->allocBytes
size_t alloc_bytes is the new variable introduced, tracking the memory allocation of each memory sparse data-structure.
Here, hashDictType / setDictType require a new pointer towards a function called allocBytes, as this size function is referred upon dictSetKey(), dictSetVal(), dictFreeKey() and dictFreeVal() to calculate the size of data held within the dictionary.
List (using quicklist), 8 bytes
From quicklist, total of 8 bytes.
- 8 bytes from ql->size_t alloc_bytes
SortedSet (using zskiplist and dict), 24 bytes
Noting that zset uses both dict and zskiplist;
typedef struct zset {
    struct dict *dict;
    zskiplist *zsl;
} zset;
From dict, total of 16 bytes.
- 8 bytes from dict->size_t alloc_bytes
- 8 bytes from zsetDictType->allocBytes
zsetDictType needs a new pointer towards a function called allocBytes, with identical reason to hashDictType / setDictType.
From zskiplist, total of 8 bytes.
- 8 bytes from zskiplist->size_t alloc_bytes
Total of 8 + 16 -> 24 bytes.
Stream (using stream)
From stream, total of 8 * number_of_streamConsumer + 8 * number_of_streamCG + 8 * number_of_rax.
- 8 bytes per streamConsumer->size_t alloc_bytes
- 8 bytes per streamCG->size_t alloc_bytes
- 8 bytes per rax->size_t alloc_bytes
I'll double check on the struct padding / internal fragmentation.
I made changes within zmalloc to allocate bytes exactly matching the new sizes, so that no additional padding / internal fragmentation is contributed. This is a necessity to optimize the updated memory usage per data-structure.
Comment From: oranagra
some things i'm not sure i understand: * why do you sum the extra pointer in hashDictType / setDictType / zsetDictType? it's one instance per server (not per key) * struct padding is not related to zmalloc, but rather the compiler. considering pointer or size_t of 8 bytes, i suppose it doesn't cause any padding, but in 32 bit builds it could (if located in a struct containing a 64 bit variable). * did you change the size classes of jemalloc? which size classes did you add? i'm not sure it's a wise idea.
Comment From: madolson
btw, lists do have dense encoding (quicklist is an evolution of both linked-list and ziplist, should have the best of both worlds).
By the definition of dense in this PR, a dense structure would just be a ziplist with the elements. It looks like we pay an extra ~40 bytes (head, tail, num nodes, num entries, fill factor/compress (This isn't 8 bytes, but my compiler aligns it to 40)) for the quicklist overhead, which is a lot. There is also the quicklist node overhead, another 32 bytes. That's 72 bytes of additional overhead for small lists.
127.0.0.1:6379> lpush example ""
1) "1"
127.0.0.1:6379> memory usage example DETAILED
1) "value_size"
2) (integer) 128 # (The ziplist is 32 bytes, 16 for robj, and 72 for quicklist is 120. There is 8 more bytes somewhere)
3) "key_size"
4) (integer) 16
5) "dict_overhead"
6) (integer) 24
I would propose an optimization where we start with just a ziplist, and once we get to a certain size, we transition to a quick list around it once we need 2 nodes. A lot of lists are tiny, since items are being pushed on and popped off.
for sets, we have the intset, and indeed we don't have a dense encoding in case the set is non-integer.
Yeah I'm aware of intsets, but we see them very infrequently in our customer workloads. I think the small set case would benefit from a listpack encoding just like we do for hashes. We can also fully reclaim the memory lost here by using a more efficient data structure. Today we just use a hash with a NULL value, that's 8 bytes per value.
Comment From: madolson
why do you sum the extra pointer in hashDictType / setDictType / zsetDictType? it's one instance per server (not per key)
Agree with Oran about this, last time we talked the 16 bytes from the hash was because of the new jemalloc arena size the object was put into.
struct padding is not related to zmalloc, but rather the compiler. considering pointer or size_t of 8 bytes, i suppose it doesn't cause any padding, but in 32 bit builds it could (if located in a struct containing a 64 bit variable).
I think the padding is just referring to the internal overhead of the jemalloc arenas, as per his later comment.
did you change the size classes of jemalloc? which size classes did you add? i'm not sure it's a wise idea.
I'd also prefer we start off not messing with these. It might be a place for future optimization, but I think we should tackle it more carefully given how little expertise we have around jemalloc.
it could be that the object has one big field, and another 2 that are short (not 10 long ones).
I'm not sure why this is a worse case. The total memory used by one 512 byte object and two 16 byte objects is still more than one 512 byte object, so the percent overhead will be lower.
Comment From: oranagra
I would propose an optimization where we start with just a ziplist, and once we get to a certain size, we transition to a quick list around it once we need 2 nodes. A lot of lists are tiny, since items are being pushed on and popped off.
you're right. for very small lists, we can use a less verbose encoding and use the encoding field in the robj to differentiate. we can create a task in the backlog for this.. it'll make a lot of mess in the code, but maybe it's worth it for people who keep a lot of short lists.
Yeah I'm aware of intsets, but we see them very infrequently in our customer workloads. I think the small set case would benefit from a listpack encoding just like we do for hashes. We can also fully reclaim the memory lost here by using a more efficient data structure. Today we just use a hash with a NULL value, that's 8 bytes per value.
i agree. let's create another backlog task for that. @madolson will you do these?
I'm not sure why this is a worse case. The total memory used by one 512 byte object and two 16 byte objects is still more than one 512 byte object, so the percent overhead will be lower.
i didn't comment about the worse case, i commented on the realistic one (arguing that the realistic one is closer to the worse case one). the worse case is a single big field that passes the encoding threshold. but the realistic case is not 10 big fields.. it's maybe one that crosses the threshold, and then a few small ones.
Comment From: madolson
i didn't comment about the worse case, i commented on the realistic one (arguing that the realistic one is closer to the worse case one). the worse case is a single big field that passes the encoding threshold. but the realistic case is not 10 big fields.. it's maybe one that crosses the threshold, and then a few small ones.
Oh, I see. I was mostly ignoring the "reasonable" cases, since reasonable is always subjective.
@madolson will you do these?
Will do.
Comment From: madolson
Some follow up notes from the core meeting (@oranagra let me know if I missed something) 1. The main benefit here is online analytics. Offline analytics is always available for slow moving datasets via snapshot parsing. So we want to make tradeoffs to optimize for that use case. 2. There are some questions about how the performance was calculated. We reviewed it internally, so @kyle-yh-kim can you just format the performance discussion and paste it here? Some internal discussion about the information was how representative it was, so it would be good to include that information as well. 3. General consensus is that the write throughput degradation, if correct, is acceptable for the enhanced tracking. 4. The memory degradation is a more significant concern. The biggest being hash/set/list. I created some other SIM #11156, #11155, #11154 to identify some areas for improvement on the memory front. We also think it might be possible to optimize the dict so that we pay 0 extra bytes for the size information until the hash becomes very large, at which point it's not a significant factor anymore.
Comment From: madolson
@PingXie @oranagra This thread has tunneled deep into one aspect of the original ask. I think memory is important, but there are a couple of other metrics which are still really useful (CPU, key count, and hit rates) which are really easy to implement. Do you have any concerns about getting the initial version of the command implemented and we can iterate on memory independently?
Comment From: PingXie
Apologies that I am quite behind on this thread. I will catch up with the discussion in the next few days.
Comment From: kyle-yh-kim
Long time no talk! I've recently came back from vacation.
To re-initiate the thread, I am dropping a summary based on our conversations thus far.
Follow-up items for slot level memory design consensus
- Paste the internal discussion on performance evaluation.
- Improve memory efficiency for dict.
We will circle back to the slot level memory design consensus, once above information is finalized and shared.
Remaining items besides slot level memory design consensus
- While waiting on memory design consensus, we could initiate implementation for the remaining metrics (CPU), along with its respective command,
CLUSTER GETSLOTINFO.
Details on slot level CPU implementation
How is it accumulated?
For its initial release, we can leverage CPU time as a proxy unit for CPU utilization. There's already an existing measurement, named duration under call(), which is used to aggregate for an existing counter commandstats. The same value can simply be aggregated under slot level context.
How is it reset?
For its initial release, the accumulated value is reset upon either;
1. slot ownership change (either the slot is removed or newly added), or
2. CLUSTER RESETSLOTINFO command, outlined below.
CLUSTER RESETSLOTINFO [CPU|OTHER_RESETTABLE_METRICS]
As for its future iterations, we could leverage trailing average as a better reset mechanism alternative. Even better, make the reset mechanism configurable, similar tomaxmemory-policy config.
Details on CLUSTER GETSLOTINFO command
Progress so far We've already brain-stormed, and re-iterated its implementation details, quoting from the original comment;
So combining with the original use case, the new command could take the following form?
CLUSTER GETSLOTINFO [SLOTCOUNT n | SLOTS s1 [s2 [s3 ...]]] [ORDERBY m [ASC|DESC]]Both
SLOTCOUNTandSLOTSare optional. When they are absent, the command returns info about all the slots hosted on the node in the order specified.
Missing details
I really like this format. To provide more details, the ORDERBY [ORDERBY_VALUE] can provide extensibility towards other metrics in the future, such as CPU, memory, hit-rate ... etc.
In total, below 3 use cases can be drafted;
1. General query.
CLUSTER GETSLOTINFO
This command returns info about all the slots hosted on the node, in a numerical sorted order based on slot number.
2. Specific query by slots.
CLUSTER GETSLOTINFO SLOTS 1 2 3 4 5
Above command should provide slot information of the given slots (1 to 5) in a numerically sorted order, based on its slot number.
To keep things simple and easy to understand (reasons why Redis is loved by the developer community), SLOTS sub-command should be a quick and simple way of obtaining slot information, and thus should not accept further filters, like SLOTCOUNT and ORDERBY (listed below).
3. Specific query by filter and ordering.
CLUSTER GETSLOTINFO SLOTCOUNT 10 ORDERBY [MEMORY|CPU|...] DESC
This is a case where complex query is required. The sub-command SLOTCOUNT sub-command can only be used in conjunction with ORDERBY. Above command should provide top 10 slots ordered by the given metric, in descending order.
Next steps
Overall, if there's no major objections on the above planning, I can start implementing the slot level CPU metrics, along with CLUSTER RESETSLOTINFO and CLUSTER GETSLOTINFO command.
In parallel, we will continue to discuss the slot level memory design consensus. For which, two action items are pending from our end.
Comment From: madolson
The overview seems good to me. @oranagra ^ Any concerns with that?
Comment From: oranagra
i don't think CLUSTER RESETSLOTINFO is needed (certainly not with such fine grained control), CONFIG RESETSTAT should be enough.
CLUSTER GETSLOTINFO, i agree that SLOTCOUNT is only useful when sorting (getting the "top" slots).
i obviously agree that in order to do sorting one must provide the column by which to sort.
my only other thought are:
1. maybe it would be also useful to provide slot ranges, rather than selecting individual slots (because there are so many of them)
2. do we really need both ascending and descending?
3. considering the arguments for the sorted one are so different than the non-sorted one, maybe it should be a separate sub-command.
Comment From: kyle-yh-kim
Agreed on skipping CLUSTER RESETSLOTINFO. As you've pointed out, CONFIG RESETSTAT is a superior candidate for resetting slot metrics.
Moving on, answers to your questions below;
1. maybe it would be also useful to provide slot ranges, rather than selecting individual slots (because there are so many of them)
Agreed. We could allow similar input scenario to that of an already existing CLUSTER ADDSLOTSRANGE.
// for individual slots, following CLUSTER ADDSLOTS
CLUSTER GETSLOTINFO SLOTS 1 2 3 4 5

// for slot range, following CLUSTER ADDSLOTSRANGE
CLUSTER GETSLOTINFO SLOTSRANGE 1 5
2. do we really need both ascending and descending?
I'd say yes, since users may also be interested in querying reverse order, to identify cold slots, then to change their usage pattern to balance out the load across cold slots & shards in association with cold slots.
3. considering the arguments for the sorted one are so different than the non-sorted one, maybe it should be a separate sub-command.
I prefer keeping them as mutually exclusive arguments under CLUSTER GETSLOTINFO, as all of them are logically grouped by the act of "getting slot information".
As well, this is an already existing behaviour for commands such as LMOVE. Instead of separating LMOVE into 4 separate commands for its source / destination LEFT | RIGHT permutations, it instead just takes LEFT | RIGHT as mutually exclusive arguments.
// Instead of...
LMOVELEFTLEFT source destination
LMOVERIGHTLEFT source destination
LMOVELEFTRIGHT source destination
LMOVERIGHTRIGHT source destination

// Looks nicer
LMOVE source destination <LEFT | RIGHT> <LEFT | RIGHT>
Similar pattern can be seen from complex commands like XREAD, where multiple optional parameters exist. Although its use-case is not 100% identical to that of CLUSTER GETSLOTINFO hopefully I am getting the right message across.
// Instead of...
XREADWITHBLOCK
XREADWITHCOUNT
XREADWITHBLOCKANDCOUNT

// Looks nicer
XREAD [COUNT count] [BLOCK milliseconds] STREAMS key [key ...] id [id ...]
Below is the relative comparison for CLUSTER GETSLOTINFO command.
// Instead of... (longer to read, harder identify its grouped nature with related commands)
CLUSTER GETSLOTINFO
CLUSTER GETSLOTINFOBYSLOTS
CLUSTER GETSLOTINFOBYSLOTSRANGE
CLUSTER GETSLOTINFOBYSLOTCOUNT

// Looks nicer
CLUSTER GETSLOTINFO <SLOTS | SLOTSRANGE | SLOTCOUNT>
That said, I suppose one could also argue otherwise. ADDSLOTSRANGE is a separate command to that of ADDSLOTS. However, if I were to design this command from scratch, I would have still preferred ADDSLOTS [SLOTS | SLOTSRANGE]. If both are doing similar actions, but with different input arguments, I'd prefer grouping them by arguments, rather than complete command separation.
Happy holidays for members from Israel btw, I heard from Madelyn that its holiday season over there.
Comment From: oranagra
agree about most of your point, some minor feedback:
i think it would be nice if SLOTRANGE can take multiple ranges. actually, i see that ADDSLOTSRANGE already does that too.
we do try to unify commands by providing arguments, instead of having 2^x permutations of each command (e.g. SET, LMOVE, GEOSEARCH, ZRANGESTORE), by in some cases it undesired (e.g. XINFO and XGROUP, before they were split into sub-commands). anyway, since the output of these two commands is the same one, and this is just a way to enable sorting, maybe one command is ok. i just want to avoid another case like CLIENT KILL, where it is impossible to understand the syntax because it's overloaded. also, another argument could be that the O(n) complexity is very different between these two.
Comment From: zuiderkwast
Just to avoid ambiguities and corner cases... what happens if the user supplies both SLOTS and SLOTRANGE and possibly multiple times? I think we can support it.
CLUSTER GETSLOTINFO SLOTS 1 3 5 SLOTSRANGE 7 10 15 20 SLOTS 25 27 SLOTRANGE 30 39
Comment From: kyle-yh-kim
Follow-up on Memory metrics
Problem recap
Our main concern was in the Hash data-type's memory consumption. Since Hash leverages dict internally which introduces size_t alloc_bytes, we incur additional memory overhead per each Hash data-type used.
Proposed solution
Madelyn (@madolson) has proposed a sparseDict solution to mitigate this memory overhead issue. The main idea here is to;
- Split the rehashidx & alloc_bytes into 32 bit fields, resulting in no memory overhead (as rehashidx used to consume 64 bits) until either of below conditions are met.
- Elements within dictionary grows to size greater than 2^31-1 (maximum integer value 4 bytes can hold), or
- alloc_bytes grow greater than 2^31-1.
- Exceeding above conditions where memory greater than 4 bytes is required, we leverage a new data-structure called sparseDict. Only within sparseDict, the alloc_bytes will have a dedicated 8 bytes in memory.
This solution is great for a couple of reasons. Although we do not completely eliminate memory overhead;
- There is no memory overhead for regular dict, defined by dictionary with elements or memory usage less than 2^31-1 items / bytes.
- While there will be memory overhead for sparseDict, the percentage overhead is extremely small, given the evolution condition from regular dict to sparseDict. It already uses a lot of memory to be converted.
Implementation details
We introduce a union field with shared rehashidx: 32 and alloc_bytes: 32 until dictionary grows into sparseDict.
Based on the latest definition of dict under unstable branch;
struct dict {
    dictType *type;

    dictEntry **ht_table[2];
    unsigned long ht_used[2];

    union {
        struct {
            long rehashidx: 32;
            size_t alloc_bytes: 32;
        } u;
        long rehashidx;
    } u;

    /* Keep small vars at end for optimal (minimal) struct padding */
    int16_t pauserehash; /* If >0 rehashing is paused (<0 indicates coding error) */
    signed char ht_size_exp[2]; /* exponent of size. (size = 1<<exp) */
};

struct sparseDict {
    dict *dict;
    size_t alloc_bytes;
}
This way, for regular dict (dictionary items or memory bytes less than 2^31-1) can leverage both rehashidx and alloc_bytes without any overhead in memory.
Internally, the design has iterated further into below code snippet, led by Avi (@avneetkg). The iterated design leverages struct inheritance.
// rehashidx and alloc_bytes have been factored out.
typedef struct baseDict {
    dictType *type;

    dictEntry **ht_table[2];
    unsigned long ht_used[2];

    int8_t pauserehash;
    signed char ht_size_exp[2];
} baseDict;

// Uses the partial 4 bytes.
typedef struct dict {
    baseDict dict;
    long rehashidx:32;
    size_t alloc_bytes:32;
} dict;

// Uses the full 8 bytes.
typedef struct sparseDict{
    baseDict dict;
    long rehashidx;
    size_t alloc_bytes;
Next steps
I plan on opening a separate issue to further discuss and iterate over the sparseDict solution. The general consensus is that - it is indeed possible to avoid memory overhead for Hash data-type. This should de-risk the memory overhead concern which has been holding the buy-in for slot level memory usage.
Comment From: zuiderkwast
Since we soon use listpack instead of dict for all types of small keys (where dict is used otherwise), the relative overhead of adding a field to the dict struct is very small already, isn't it? Perhaps it's enough? The sparseDict idea adds some complexity only to save one word per dict...
Comment From: kyle-yh-kim
Yes, I see your point as well.
The sparseDict also has the advantage in saving memory for Set data-type as well. Though - I've also heard this being refactored to be more memory efficient.
I'd like to gain more information on the conversion trigger from listpack to dict for the Hash data-type. Honestly, if listpack can hold large amount of data until dict conversion, I agree that sparseDict won't be necessary.
I will summon Madelyn (@madolson) on this thread. I heard that there has been some updates from today's core meeting.
Do we still care about sparseDict? More importantly, how do we feel on proceeding further with the per-slot memory metrics?
Comment From: oranagra
Viktor is referring to #11290 where sets will use listpack too.
however, i don't think we can really rely much on the fact the smaller ones use listpack. listpack is intended to be memory efficient but not very performance efficient (searching is O(n) instead of O(1), and any insertion and deletion requires realloc and memcpy), in some cases we switch to dict encoding even if the collection is rather empty (e.g. when one element is bigger than the size threshold).
we can easily compute the relative overhead considering the smallest dict according to the thresholds (either a single item of more than 64 bytes, or 512 items of just 2 bytes), maybe we already did? but remember these thresholds are tunable, and we expect deployments who need better performance than what listpack can provide to lower them (maybe we can argue that these deployments can't have strict memory concerns though).
on the other hand, i do i agree that the unions or two dict structs design adds complexity (and possibility for bugs or difficulty doing other changes), and might not be worth it considering the relative overhead percentage is anyway very low.
i think the main reason against this (being one design or another) is that it might not be at all necessary, i.e. paying an efficiency or complexity price for a feature that may not be needed most of the time, and that offline analysis could be enough.
Comment From: kyle-yh-kim
Sounds like we are moving towards a greater discussion, that is; 1. Online analysis 2. Offline analysis
Before I drop further comments on their trade-offs and preference, I'd like to request for clarification on the "offline analysis".
Is the idea to take an RDB snapshot, to be restored in either the same or separate machine, then start redis-server with a start up config, say --offline-analysis, which will generate a report of slot statistics?
Comment From: oranagra
could also be a 3rd party tool / script (we do plan to have a librdb.so as part of our project). the point was (and i think we already covered it a few months ago) that even if the overhead is small, maybe it's not right to have it (constantly) if it's not often needed, and can be achieved (with some inconvenience) in another way. it's hard to decide one way or another, it depends on how small the overhead or extra complexity is.
Comment From: madolson
@oranagra We've talked about offline vs online analysis a couple of times now, and I don't think we're making progress. I'm not convinced we need more data at this point to make a decision, most of it has been laid out in this thread, and it seems like we're stuck in analysis paralysis.
To answer your question, offline analysis does not work for our use case because it's too slow and/or too complex to keep track of. If we don't have snapshots handy, taking one is very expensive. If we want to be able to quickly do resharding, we don't want to wait to take a snapshot to figure out the distribution. I also think offline analysis is a worse user experience compared to just having the data available in an online way. When someone is looking to make a scaling decision, I think it's a bit unreasonable to ask them to run through a tool to make a better scaling decision. Naive scaling can work in some situations, but it doesn't always work well when clusters become larger.
@redis/core-team Still waiting for most of the other folks to weigh in. The question is it it worth paying the costs outlined here: https://github.com/redis/redis/issues/10472#issuecomment-1207603354 to have realtime memory usage per slot as well as O(1) memory size computation.
Comment From: kyle-yh-kim
A few more points I'd like to add. I will stay as objective as possible in writing down my final thoughts below.
Case 1: Support for advanced memory statistics
1. DBMEMORY (tentative naming) command to track memory usage per-database
We already accumulate memory usage per-slot. Modification to support per-database (for CMD users) is extremely simple. This is a highly requested feature from the open-source community, based on my conversation with Madelyn (@madolson).
2. MEMORY USAGE command improvement
As we track memory usage at per-key level granularity for online analysis, the already existing MEMORY USAGE command will provide exact amount of memory used, at O(1) run time. This is a huge improvement from the existing naive average projection approach.
3. BIGKEYS [TOP N], HOTKEYS [TOP N] (tentative naming) command
This also provides a foundation for BIGKEYS [TOP N] (tentative command naming), where users can obtain TOP N largest keys in memory usage, something I am extremely excited about. HOTKEYS [TOP N], ranking keys based on hit rate, would be a great addition to this roadmap.
Above commands (which are online and live) are something everyone, not just CME users, will benefit from. While offline analysis could be performed over above metrics, users will have to go through complex and lengthy process, detailed below.
Case 2: User experience simplicity & consistency of Redis
Redis is loved for its simplicity. As a user, the best experience will always be, query and obtain information in the most accurate and live form.
The workflow for offline analysis will be;
- [Not instantaneous] create an RDB from a production redis-server, then depending on the implementation, either;
- [Not instantaneous] If production is not to be disturbed, copy over RDB to a different non-production hardware with redis-server running, or;
- [Not instantaneous] If production is to be disturbed, run a command on the production redis-server to analyze the RDB snapshot into slot information.
Above is a lot to ask for our users, to answer a very simple question; "How much memory does each slot consume?" As well, for quick online re-sharding - it is quite unreasonable to ask the open source community to run through above process / 3rd party tool to make a scaling decision.
The workflow for online analysis will be;
- [Instantaneous] run
CLUSTER GETSLOTINFO. All calculations have been amortized.
Online analysis is simple to use, and stays consistent with the existing info commands, such as CLUSTER INFO or MEMORY USAGE.
We already plan to provide key count and CPU duration under the CLUSTER GETSLOTINFO command (1st PR link). Adding memory usage will meet consistency with upcoming use cases. From user perspective, it feels unnatural to obtain key count and CPU statistics from CLUSTER GETSLOTINFO, but memory usage from offline analysis.
Case 3: Feature richness
Online analysis will be able to support the following features;
- Live slot usage statistics
- Live memory usage statistics per key
- Live / instantaneous re-sharding
- [Upcoming] Advanced key statistics, such as BIGKEYS HOTKEYS
In summary, anything offline analysis does, online analysis can support, at instantaneous / live manner.
Not to mention, by the time offline analysis is completed, slot usage could look very divergent from the previously captured RDB.
Case 4: Performance, memory and infrastructure cost
For online analysis, TPS and memory impact can be noted here. From earlier discussions within this thread, TPS was deemed acceptable.
Memory overhead, while unavoidable, we are making mitigation efforts by sparseDict introduction. It is also important to note, that the two most widely used data-types, String and Hash, will have non-existent memory overhead with this mitigation. Other data-structures can also be iterated in the future for improvements.
There's no additional infrastructure cost, as online analysis will work out-of-the-box without any need for separate hardware setup, which offline analysis requires if production load is not to be disturbed. Here, "production" should include both master and replica, as replica nodes serve read traffic.
We do not have any numbers for performance overhead in offline analysis, but all degradations will exist in varying degrees. In high-level, users can expect higher TPS degradation (due to RDB snapshot) everytime slot information is requested, but lesser memory overhead - as it does not scale by the number of keys. Infrastructure cost will incur if production load is not to be disturbed.
Case 5: Maintenance burden
This is applicable for both offline and online analysis.
Both will require capturing of memory usage upon introduction of new non-memory-contiguous data-structure (like dict, stream ... etc.)
That said, offline analysis will only require memory usage calculation for data-structure methods used during rdbLoad(). Due to leveraging rdb, offline analysis will hold an additional maintenance dependency in rdb changes.
We should also account for how often core changes like data-structure introductions / rdb changes occur. Depending on its frequency, it should be weighed more / less.
Final thoughts
With respect to all the trade-offs discussed above, I am ultimately in support for the online analysis approach. Yes, the performance and memory overhead exists, but they are extremely minimal. TPS has been deemed acceptable, and we have active mitigation plans which eliminates memory overhead for the two most widely used data-types, String and Hash.
The feature's richness, instantaneous accuracy, and simplistic use-case outweighs the qualitative cons, which both online and offline analysis possesses.
I believe I have written everything I could in this thread. Now, I will wait for the final decision to be made by the core members.
In the end, we are all working on behalf of the open source community and its users. Although the eventual decision is yet to be settled, I have no doubt in the final decision to honour the best interests of our community. For 5 consecutive years, Stack Overflow Developer Surveys have proven this statement. From the user experience perspective, my stance is clear.
Comment From: kyle-yh-kim
^ Apologies, it was supposed to be "a few points", but grew to be an essay. Still working on my writing skills.
Aside from memory metrics, I will post a few questions regarding the already agreed CLUSTER GETSLOTINFO soon.
Comment From: kyle-yh-kim
Regarding CLUSTER GETSLOTINFO, a few change proposals.
1. Rename to CLUSTER SLOT-STATS.
We shouldn't include GET prefix when the command is clearly a get. Following identical command standard to MEMORY STATS and MEMORY MALLOC-STATS.
2. Mutual exclusivity of sub-arguments
Option 1. Mutually inclusive
CLUSTER SLOT-STATS
[SLOTS slots [slots ...]]
[SLOTSRANGE start-slot end-slot [start-slot end-slot ...]]
[ORDERBY column [LIMIT limit] [ASC|DESC]]
- Pros: Highly flexible. Users can call the commands in various ways.
- Cons: Documentation and implementation will look dirty.
CLIENT KILLis a good example raised by Oran. Do we really see users running various combinations? it's excessively free and complex.
[Preferred] Option 2. Mutually exclusive, notice the | separator
CLUSTER SLOT-STATS
[SLOTS slots [slots ...]]|
[SLOTSRANGE start-slot end-slot [start-slot end-slot ...]]|
[ORDERBY column [LIMIT limit] [ASC|DESC]]
- Pros: Readable and easier to maintain.
- Cons: Lack of high flexibility.
Generally, I don't see much use-case in using all sub-arguments at the same time.
If you'd like to ORDERBY to identify hot slots, why wouldn't you want to do it across the entire shard? Vice versa, if you are querying for specific range of slots, you probably wouldn't rank them through ORDERBY, you will only be locating local maxima and minima.
Next steps on CLUSTER SLOT-STATS and CPU metric
I'm currently working towards a PR, moving forward with the preferred options listed above, with sample responses below.
127.0.0.1:6379> CLUSTER SLOT-STATS SLOTS 1 10 100
1) (integer) 1
2) 1) "key_count"
   2) (integer) 0
3) (integer) 10
4) 1) "key_count"
   2) (integer) 0
5) (integer) 100
6) 1) "key_count"
   2) (integer) 0

127.0.0.1:6379> CLUSTER SLOT-STATS ORDERBY KEY_COUNT LIMIT 2 DESC
1) (integer) 16381
2) 1) "key_count"
   2) (integer) 1
3) (integer) 0
4) 1) "key_count"
   2) (integer) 0
As for the memory metrics discussion, I'll have my progress paused until the decision is settled in the coming core meeting.
Comment From: kyle-yh-kim
I have opened two separate issues to de-couple the already approved changes (CLUSTER SLOT-STATS and cpu_usage) to the on-going discussion with slot level memory usage (which this thread has evolved into).
You may expect PR for #11422 the coming Monday, 11:59 PM EST. PR for #11423 will follow after the merger of the #11422 (pre-requisite PR).
Comment From: kyle-yh-kim
PR for CLUSTER SLOT-STATS has been opened; https://github.com/redis/redis/pull/11432/
As stated earlier, the command introduction will be tracked under a de-coupled issue; #11422.
Comment From: kyle-yh-kim
Prior to the decision making on the upcoming core meeting (October 31st 2022), I am writing a summary of my earlier points in a visually digestible format, attached below.
Feature richness and extensibility

Performance overhead
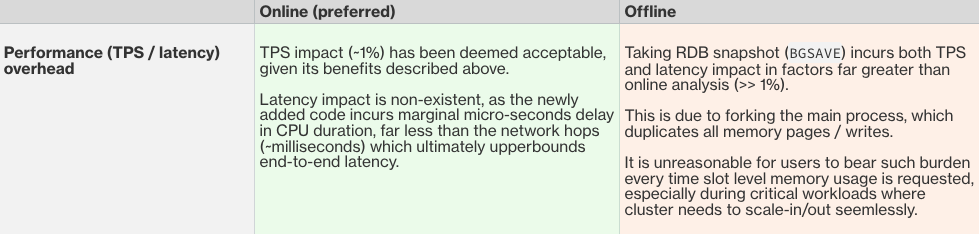
Memory overhead
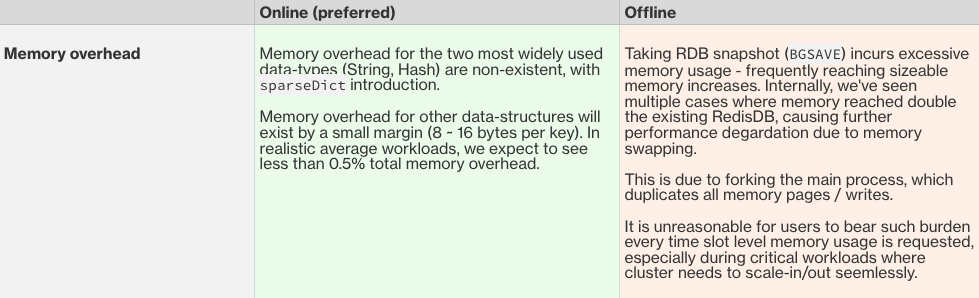
Infrastructure overhead
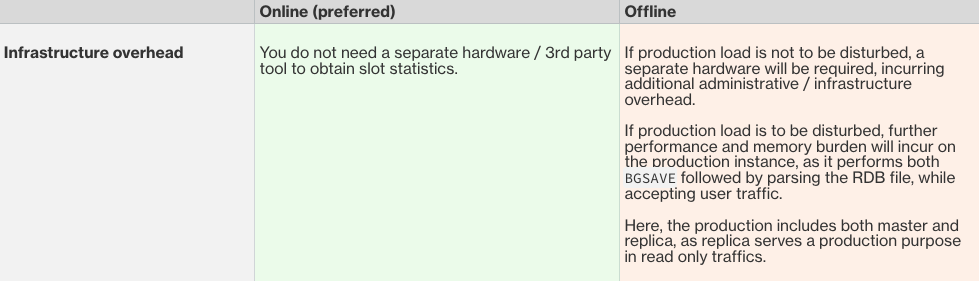
User experience
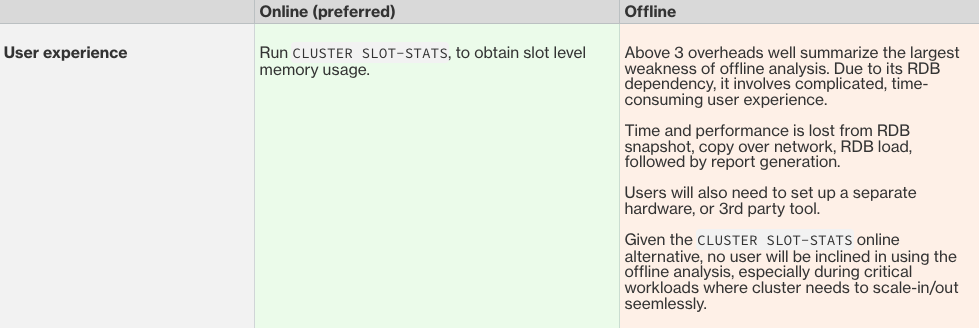
Maintenance
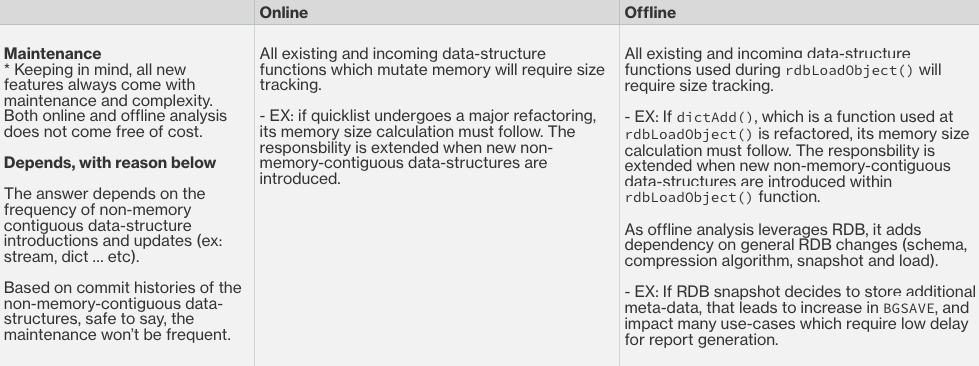
Main concerns of offline analysis
Asking users to take an RDB snapshot to obtain slot level memory usage at every request is quite unreasonable. The negative user experience can be summarized under 3 factors.
1. High performance / memory degradation
Users will request for this information during peak load, to perform online re-sharding. BGSAVE already consumes significant amount of CPU and memory, and its impact will be further amplified during critical workloads where cluster needs to scale-in/out seamlessly.
Specifically in memory overhead during BGSAVE, we have seen frequent cases where memory usage reach double the size of RedisDB. This usually leads to further performance degradation due to swapping of memory.
Redis Insight, Memory Analyzer Tool also acknowledges this fact, source.
In summary, RDB snapshot is an expensive operation, and should be decoupled when alternatives, like CLUSTER SLOT-STATS command, with acceptable trade-offs, is available.
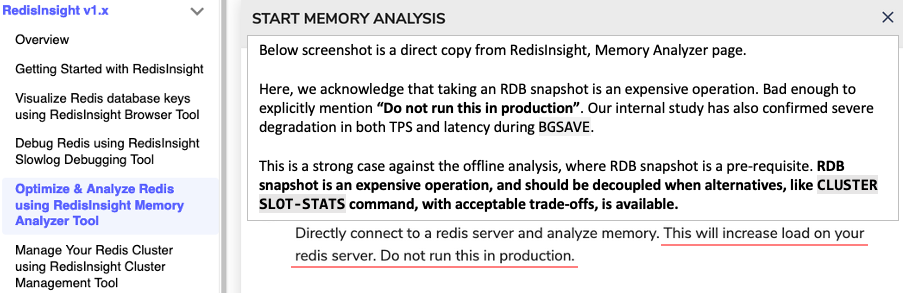
2. Complicated user experience, and time consuming steps from taking, copying, then loading RDB snapshot
With offline analysis, we offload more responsibility from redis-server to its user. Take an RDB snapshot, copy over, then load it in a separate hardware that is isolated from production.
These steps introduce more friction and time consumption, in comparison to the online analysis and its superior access through a single command; CLUSTER SLOT-STATS.
3. Out-of-date accuracy
There does not exist any guarantee on the accuracy of slot level memory usage by the time of offline analysis completion. This is further amplified by the "time consumption" mentioned above. Greater the delay, greater the inaccuracy compared to the live usage patterns. Report is worth as much as its accuracy.
This may be sufficient in studying weekly usage patterns, but not sufficient in many features live and instantaneous memory statistics can support.
Potential lingering questions
I suspect below questions to be raised during the core meeting.
Q1. Doesn't offline analysis still solve cases where speed of report generation is not necessarily important?
- You are correct that offline analysis solves "some" problems, but not all. I can name many problems that can be solved by online analysis. I can not do the same for offline counterpart.
- And not only the speed, its performance / memory overhead during
BGSAVEincurs unreasonable degradation at every request for slot metrics. - Most importantly, online analysis is a super-set of offline analysis. Anything offline analysis can do, online analysis can do better, at live and instantaneous manner. If online analysis is deemed to have acceptable trade-offs, with greater benefits, then it makes more sense to allocate priority and efforts in implementing online analysis.
Q2. Why don’t we just use the existing MEMORY USAGE, and approximate slot level memory usage?
- High accuracy is a necessary non-functional requirement for many problems
CLUSTER SLOT-STATSmemory attempts to solve. - To provide one example, for online re-sharding - without accurate memory measures, balancing memory usage across shards will become extremely challenging, due to below statistics.
- The likelihood of sub-keys being homogeneous in memory usage is low.
- The likelihood of first 5 elements being an accurate representation of the remaining sub-keys is also low.
- Examples:
- Stream: messages will be highly uneven in its length and memory usage.
- SortedSet: leader-board with varying user-names will be highly uneven in its length and memory usage.
- Hash: product catalogue and its descriptions will be highly uneven in its length and memory usage.
- List: queuing of messages will be highly uneven in its length and memory usage.
- These are not cherry-picked, but realistic average use-cases of Redis. The list goes on (no pun intended).
- Therefore, the existing
MEMORY USAGEcan not be relied in online re-sharding, as it can not yield memory balanced shards.
- Finally, the tradeoffs for accurate memory usage was already deemed acceptable.
Q3. What about Modules?
- No breaking changes are introduced. We already have
moduleGetMemUsage(), which refers tomem_usageormem_usage2. Each module already implements its own memory usage function. - Currently, we don’t enforce sampling of first five elements for modules, like we do with
objectComputeSize(). Applying identical standards, this is not a concern.
Q4. What about the added maintenance and complexity?
- Before discussing further on this point, we must first come to a mutual understanding; "No feature comes free of maintenance / complexity cost." Offline analysis does not come free of maintenance and complexity cost. This has been already discussed extensively under the above "Maintenance" section. Offline analysis also require memory tracking for all data-structure functions used at
rdbLoadObject(). It also adds dependency on RDB core logic and its performance, since it relies on RDB snapshot generation and loading. - I've went ahead and aggregated all non-memory-contiguous data-structures, and their mutation path modifications (anything that touches the way memory mutates, and thus memory tracking also need change). Safe to say, it happens very infrequently.
Voice of AWS ElastiCache Redis customers
Before speaking further, I wish to reaffirm my position, as one of many Redis open source contributors. I am committed for the success of Redis, and am not operating at the limited interest of AWS ElastiCache.
AWS ElastiCache represents a sizable population of Redis users. This is not to say that our opinions weigh more. As you may already know, Redis community does not have a single point of contact, as it is served across multiple platforms - which is a good thing, no one entity should own Redis!
I am simply providing a subset of Redis users voice, as AWS conveniently provides a single point of contact through sales and support. We have received user feedback in the lines of; - Better re-shading for CME. - Obtain up-to-date & accurate per-slot / per-key / per-data-type / per-database memory usage, to better understand Redis usage pattern, and change client behaviour. - Obtain up-to-date & accurate list of keys sorted based on memory usage and hit rate, to better understand Redis usage pattern, and change client behaviour. - Obtain up-to-date & accurate memory usage of user data (excluding all administrative / temporary overhead).
I am confident that the innovation in online analysis of slot level memory metrics, to greatly benefit the Redis community as a whole.
1) Re-sharding will be made simple and accurate. The current re-sharding strategy of "guessing" a balanced memory usage based on the number of slots and keys is far from being sufficient.
2) Users can query exact amount of memory used per-slot / per-key / per-data-type / per-database at a live and instantaneous manner.
3) Provide extensions towards advanced Redis statistics that is multi-fold performant than the existing solutions, such as BIGKEYS vs redis-cli --bigkeys, and HOTKEYS (tentative command naming).
With online analysis, above benefits can be delivered in a single command CLUSTER SLOT-STATS, which;
- Does not involve 3rd party tool with extra cost
- Does not require additional infrastructure for report generation
- Does not depend on RDB snapshot incurring large performance / memory overhead
- Does not require complicated and time-consuming steps
To answer what is a simple question in nature, "How much memory is used per-slot?"
Comment From: oranagra
that's too long, but i skimmed though it, and i have a few quick and raw responses: * bigkeys and hotkeys requires another data structure to maintain and adds more overheads. considering redis avoids sorting keys by LRU and TTL (for more important features of redis), it should probably not make that compromise. * i'm still not sure how we'll handle modules, and keep the per-slot metrics up to date (calling the existing callbacks per executed command is obviously wrong) * arguments about the complexity of an offline tool are not really relevant, here we need to guard the complexity of redis, we rather some external tools being complex rather than the internals of redis (possibly limiting future developments of the core)
the bottom line as far as i can tell is that we have two alternatives, one doesn't add much complexity but has higher memory impact, and one with lower memory impact but a bit more complexity.
Comment From: kyle-yh-kim
Thanks for your prompt response. I respectfully disagree on your comments, with follow-ups attached below.
BIGKEYS, granted that each key will track its own memory usage, only require a simple min-heap data-structure, as I stated earlier. The size of min-heap will be governed by the users through a config, saybig-keys-maximum-list-size. We can further restrict the maximum size at 10. It is a fixed memory overhead that does not grow with the number of keys, less than 0.01 Mb of fixed memory. Time complexity ofO(log(10))per insertion is basically free of cost. And this will be much much more performant than theSCANbasedredis-cli --bigkeys- Why is the existing callbacks, which is purpose designed for obtaining its memory usage, an obviously wrong solution? We already do this for
MEMORY USAGE <key>. Its performance depends on the implementation, but most modules either provide sampling method (which is performant), or keep track of its size and return atO(1). Do we really have an example of a highly used module that calculate its size by iterating through each and every sub-key? The decision here should be data-driven. - Arguments on offline tool complexity is valid. We should not skip this complexity when we are building a solution that implements how users will obtain memory statistics per slot. In fact, this was the very initiative of this thread in the first place. Please refer to Ping Xie's comment upon opening this issue.
From Ping Xie, source.
With the new slotToKey struct, it is possible to start tracking some metrics, such as memory usage (key size + value size but not counting fragmentation) and keyspace_hits, at the slot level. I can see this information being useful for an application to understand the skew in its workload.
To your comment,
The bottom line as far as i can tell is that we have two alternatives, one doesn't add much complexity but has higher memory impact, and one with lower memory impact but a bit more complexity.
- In addition to memory impact, we should also consider offline analysis's performance degradation from memory swapping due to memory overhead from
BGSAVE. This happens quite frequently, causing pain-points for the Redis community and its users. - Also, I would not conclude offline analysis maintenance to be any greater / lesser than its online counterpart. The answer "depends". For more details, please refer to the table under "Maintenance" section.
I will now re-emphasize my summary on the offline analysis and its dependency with RDB below.
Specifically in memory overhead during
BGSAVE, we have seen frequent cases where memory usage reach double the size of RedisDB. This usually leads to further performance degradation due to swapping of memory.RDB snapshot is an expensive operation, and should be decoupled when alternatives, like
CLUSTER SLOT-STATScommand, with acceptable trade-offs, is available.
Having answered above questions, my follow-up question would be;
- Are we really going to ask our users during critical workloads, to take a BGSAVE which is already known to cause severe performance degradation and memory overhead, including the memory swapping from added memory overhead? This is not an extreme use-case, as critical workloads demand information on hot-slots and hot-shards the most. Is this really the experience the Redis community would prefer, over CLUSTER SLOT-STATS?
- Keeping in mind, offline analysis only answers out-of-date slot level memory usage.
- Online analysis as a by-product, provides so much more than just slot level memory usage, such as accurate MEMORY USAGE <key>, BIGKEYS [TOP N], DBMEMORY <db_number> ... etc.
Comment From: oranagra
forgive me for my ignorance, but if the min-heap is so small, what would happen when all items are removed and the remaining big items are stale? if it was that simple, we would have used it for eviction and expiration 8-)
the modules that implemented the memory usage callback, didn't not consider that it'll be implicitly be called each time the key is modified.
The bottom line as far as i can tell is that we have two alternatives, one doesn't add much complexity but has higher memory impact, and one with lower memory impact but a bit more complexity.
i meant the two alternatives for online analysis, one with an additional dict field, and one with a union.
are you referring to bgsave impact on a system that uses swap (which i'd consider a wrong configuratoin)? or on it's impact on the CPU cache?
Comment From: madolson
if it was that simple, we would have used it for eviction and expiration 8-)
If we only had to keep track of like 5 keys to evict, it would be that simple :).
Comment From: kyle-yh-kim
that's too long, but i skimmed though it, and i have a few quick and raw responses:
Before I further contribute to this thread - I wish to re-emphasize the importance of the previous summary. I acknowledge that the length is long, and I apologize again for this (writing is indeed a life-long skill-set). Moving forward, I will add lengthy sections under Appendix, for better reading experience.
The intention is to provide as much detail as possible, given that we (myself and the redis-core members) do not hold the privilege of directly communicating through slack nor voice chat.
I believe that the comments (including this one) are worth reading thoroughly before making the final decision, to honour the best interests of the Redis community, and not at the limited interests of 3rd party vendors.
Pressing on, my answers are attached below.
BIGKEYS minheap feasibility, and online analysis extensibility
forgive me for my ignorance, but if the min-heap is so small, what would happen when all items are removed and the remaining big items are stale.
Yes, this is indeed a problem. In cases where all big keys are removed, and the user never re-touch the remaining 11 ~ 20th largest keys, the big keys would lose its accuracy.
The main role of the tentative BIGKEYS command, is to signify the extensibility of advanced live usage statistics the online analysis provides to all Redis users, CME and CMD inclusive.
This shouldn't take away from online analysis's capability in many other advanced live usage statistics, such as;
- used_memory_string
- used_memory_hash
- used_memory_set
- used_memory_list
- used_memory_stream
- used_memory_sortedset
- used_memory_dataset (improved and more accurate, as we now directly calculate used memory for dataset instead of reverse subtraction of all non-dataset overheads)
- MEMORY USAGE <key> (at O(1), with improved accuracy).
- DBMEMORY <db_number> (at O(1), extending to the DBSIZE command)
- CLUSTER SLOT-STATS (at O(16384), provides accurate memory usage per-slot at live time).
Until the eventual BIGKEYS command implementation, Redis will still greatly benefit from the improved ./redis-cli --bigkeys, which will leverage the improved O(1) time and highly accurate objectComputeSize() from per-key accurate memory usage tracking. Attached below are inaccuracy factors of the current MEMORY USAGE <key> implementation, based on my previous comment;
- Stream: messages will be highly uneven in its length and memory usage.
- SortedSet: leader-board with varying user-names will be highly uneven in its length and memory usage.
- Hash: product catalogue and its descriptions will be highly uneven in its length and memory usage.
- List: queuing of messages will be highly uneven in its length and memory usage.
- These are not cherry-picked, but realistic average use-cases of Redis. The list goes on (no pun intended).
Circling back - clearly, BIGKEYS is a technical challenge of its own class, which require a dedicated thread following the decision in online vs offline analysis. I re-track my statement on "only require a simple min-heap data-structure" to solving this problem. Thanks for the critical feedback, it helps me grow as an engineer. I appreciate it.
Modules
the modules that implemented the memory usage callback, didn't not consider that it'll be implicitly be called each time the key is modified.
As I stated earlier, its performance indeed depends on module's implementation. However, we must note that redis-server MEMORY USAGE <key> samples a fixed number of 5 items. This sampling window is not even user configurable, but rather defined by the macro OBJ_COMPUTE_SIZE_DEF_SAMPLES upon compile time. Safe to say, MEMORY USAGE <key> has set a strict standard of O(5) --> O(1) time complexity.
Generally, modules follow standards that have already been paved by the redis-server implementation. The decision should be data-driven. I would like to see a data-type module that is of high popularity (and thus well reflective of the average Redis users and their interests), which calculate memory by iterating each and every sub-key, instead of following the 5 elements sampling standards Redis has kept for the past 6 years - and since the introduction of the very command MEMORY USAGE <key>(original commit link).
Dict fields and union
i meant the two alternatives for online analysis, one with an additional dict field, and one with a union.
The sparseDict POC was shared to show the possibility of eliminating memory overhead. We don't have to take this route if there are other alternatives.
Speaking of which, we are already making meaningful progress on #10802 Rethinking the main Redis dictionary, where we project to save memory overhead multiple folds of sparseDict mitigation.
From a holistic stand-point, users won't notice much difference, or even less memory consumption with all changes in place. The two changes compromise each other well.
Swap memory
are you referring to bgsave impact on a system that uses swap (which i'd consider a wrong configuratoin)? or on it's impact on the CPU cache?
I will provide some clarification on swap. It is wrong to configure your Redis server, such that swap memory is used under regular / average workloads. All Redis data must be served in-memory, in an ideal world and workloads.
However, the swap usage here does not stem from average workload, but rather during memory pressuring moments - such as increase in replication output buffer, or the copy-on-write during BGSAVE as you've correctly pointed out.
These memory overheads (which can frequently grow up to double RedisDB size) are excluded from used_memory calculation under eviction context, and does not trigger key evictions to prevent redis-server from crashing due to OOM. This is clearly outlined under evict.c.
Since we can not fully rely on eviction, to safe guard from redis-server OOM crashes, it is rather preferred to set up a reasonable swap space, to be spilled during memory pressuring workloads, then to be brought back in-memory once workload simmers down. And thus, sizeable Redis users configure their instances with swap memory.
One may argue, "But doesn't this mean they have under-provisioned their memory resource in the first place? If they fall back to swap memory during critical workloads, then clearly they didn't think through of all edge cases". Well - unfortunately, this turns out to be an extremely hard problem to solve. Workloads come and go, and is extremely challenging to predict.
On the opposite end, over-provisioning memory resources by a few folds would lead to huge costs at Redis users' end. We have seen frequent cases where memory usage reach double the size of RedisDB, so over-provisioning memory resource by x2 folds is still considered inadequate in avoiding swap memory. Again, this is not an extreme use-case, as critical workloads demand information on hot-slots and hot-shards the most.
The Redis community also seem to be in an agreement with BGSAVE performance bottlenecks. Quoting directly from Redis Persistence documentation;
RDB needs to fork() often in order to persist on disk using a child process. fork() can be time consuming if the dataset is big, and may result in Redis stopping serving clients for some milliseconds or even for one second if the dataset is very big and the CPU performance is not great.
This brings to my previous question that is yet to be answered. We can mutually agree that BGSAVE and its performance and memory impact with or without swap memory usage, brings a lot of concerning variables in play, especially in hot-shard / hot-slot scenarios when slot level memory metric becomes most valuable.
- Are we really going to ask our users during critical workloads, to take a
BGSAVEwhich is already known to cause severe performance degradation and memory overhead, including the memory swapping from added memory overhead? This is not an extreme use-case, as critical workloads demand information on hot-slots and hot-shards the most. Is this really the experience the Redis community would prefer, overCLUSTER SLOT-STATS?
- Keeping in mind, offline analysis only answers out-of-date slot level memory usage.
- Online analysis as a by-product, provides so much more than just slot level memory usage, such as accurate
MEMORY USAGE <key>,BIGKEYS [TOP N],DBMEMORY <db_number>... etc.
And no, my comment was not regarding CPU cache.
Comment From: oranagra
regarding modules, even if the overhead of re-sampling the memory usage of the key is O(1), running that per executed command could be a severe performance regression (of 50% or even more in some cases, depending what the command does).
Are we really going to ask our users during critical workloads, to take a BGSAVE which is already known to cause severe performance degradation and memory overhead, including the memory swapping from added memory overhead?
it all depends on the overheads... you would probably agree that if accurate memory accounting took extra 20% memory, then it's not a good idea to inflict that overhead on all users, even ones that don't require that feature.
and note that provisioning the database in a way that will allow creating snapshots is a concern that's not going away even if you solve the memory metrics problem, so the database has to be provisioned in a way that will allow it (both in terms of not crashing, and also in terms of the application being ok with any performance degradation at that time)
Comment From: kyle-yh-kim
and note that provisioning the database in a way that will allow creating snapshots is a concern that's not going away even if you solve the memory metrics problem, so the database has to be provisioned in a way that will allow it (both in terms of not crashing, and also in terms of the application being ok with any performance degradation at that time)
Yes, and this is the very problem we are trying solve, through either 1) online, or 2) offline analysis.
During memory pressing moments (not just limited to BGSAVE), by providing Redis users their detailed slot level memory metrics, the users are now empowered to perform an informed and strategic live re-sharding to alleviate hot slots and hot shards problem.
The issue will no longer reoccur until the foreseeable future, as the Redis cluster has become balanced, thanks to the use of slot level memory metrics. Again, this information will be provided through either 1) online, or 2) offline analysis.
While our preferences in "how" may not be identical, I see the common desire in the betterment of Redis community and its users.
Taking a step back, I will now pause on further discussions on this thread, aside from ad-hoc clarification requests on my previous messages, if needed.
As we can all agree, the thread has accumulated sufficient context / trade-offs in both 1) online, and 2) offline analysis. We have touched upon their high-level designs, core complexity, performance / memory overheads, dependency in RDB and Modules, and so on.
We have now entered a cyclic feedback loop, where discussion goes in the format of; "Depends on the trade-offs", followed by repetitively providing evidences, use-cases and trade-offs which have been already shared and/or agreed upon previously. The interaction is no longer profitable, for both the thread participants and core decision makers. Admittedly, I've partaken in this behaviour to a degree.
Clearly, it is not an easy decision to make. The outcome of online vs offline analysis rightfully deserves a formal redis-core intervention, reflecting the Redis community's will, alongside the core members' keen judgement.
In the meantime, I will be working on the 2nd revision of the CLUSTER SLOT-STATS command (link), along with cpu_usage implementation (link).
Comment From: madolson
So, the core group reviewed the four options that have been discussed around this thread: 1. Offline analysis: Using an external tool to parse an RDB to provide this information. We generally believe this is a good option if you need precise information, but it not an ideal situation for the use case being discussed which is real time scaling decisions. 2. Thread local memory allocations: This option involved making the needed changes to the allocation system to keep track of which memory is allocated to which slots. Although it sounds promising, we don't have a good solution that won't either cause memory fragmentation or require additional memory. 3. Have datastructures track memory: In this approach, we keep a precise tracking of all memory allocated for each datastructure. This included a minor performance and memory penalty for the "sparse" data structures. 4. Implement an "iterator" based approach for memory. An iterator would scan through the keyspace (either in a fork or as a cron) to determine how much memory is in each slot.
The general consensus is that feature should be "opt-in" only, and shouldn't cause degradation if it's disabled. If we can get the memory and performance profile to be identical to having the feature disabled, then we will accept it. The preference was also that "approximate memory usage" was preferable if it kept the implementation simple. This lead us to believe that option 1 and 4 was the best approaches moving forward. Option 1 if you needed precise memory and option 4 if you were okay with approximate memory usage.
I believe option 4 can also be "enhanced" with some of the ideas we've talked about in this thread. For example, we can keep track of all of the memory stored in the dense data structures but not track them for the sparse structures and use the scanning based approach.
Comment From: PingXie
I finally got time to catch up with this thread. Thanks a lot for all the technical details and data points, everyone. Really appreciate it.
I agree it is a valid concern that the increased memory footprint is more significant for the smaller sparse data structures. I think it makes sense to focus on other slot level metrics and the command interface for now while we continue to find ways to improve memory efficiency. Will help review the pending PRs from @kyle-yh-kim next.
Comment From: kyle-yh-kim
Thanks for your continued interested @PingXie.
As for the core group's summary, I note the following requirements; 1. The feature should be "opt-in" only, and shouldn't cause degradation if it's disabled. 2. Simpler implementation is preferred over accuracy. Approximation of memory usage should suffice for online analysis.
Following above requirements, I'd like to propose an updated design alternative - Amortized per mutative command, with approximated key space.
The design is identical to that of amortized per mutative command, with the absence in data-structure size tracking. Instead, we use a performance optimized objectComputeSize() to obtain the approximated memory usage of the key space before and after each write command.
The maintenance cost of data-structure size tracking is now mitigated, along with memory overhead stemming from size_t alloc_bytes parameter. The amortized calculation will latch on top of the already existing hooks;
- lookupKeyWrite(): To obtain approximated key space before mutation, and
- signalModifiedKey(): To obtain approximated key space after mutation
The feature can be easily config-guarded behind either server.cluster_enabled, or a new config if CME users do not wish to leverage this feature by default.
I'd like to hear your thoughts on this proposal. I prefer the amortized calculation over on-demand fork() / cron iteration for the reasons of;
1. fork() causes significant spike in performance / memory overhead throughout its duration, due to copy-on-write nature.
2. cron job will have performance degradation larger than amortization. dictNext() against the entire RedisDB is an expensive operation to run in the background - relative to that of amortized approach. If number of keys per cycle is reduced to bring reasonable performance, then the slot metrics report generation time will suffer due to slower cron.
Comment From: kyle-yh-kim
Also, regarding below point;
If we can get the memory and performance profile to be identical to having the feature disabled, then we will accept it.
We found a way of optimizing memory and performance profile such that there exists zero performance / memory overhead when the feature is disabled.
Of course, the trade-off here is that the implementation complexity will be similar, as it would require thread-local-storage variable to track the slot number, followed by zmalloc.c/h to read these intentions and update slot metrics array accordingly after every relevant zmalloc calls. Basically the "Option 1" discussed earlier within this comment.
In such case, can this still be accepted - or do we require a reduced level of complexity as part of the non-functional requirements of slot level memory metrics?