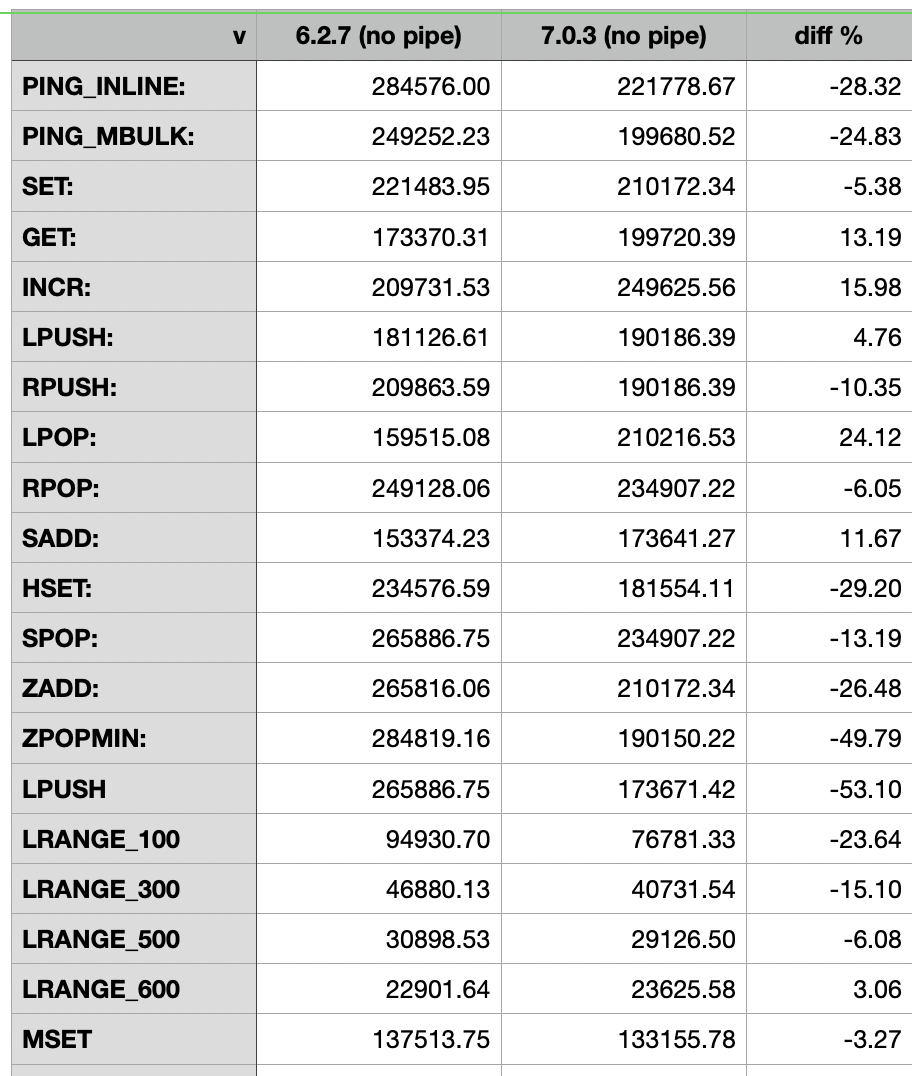
Hi, I tested on different systems, but every time the results are the same, 7.x works worse than 6.x. (config attached)
redis-benchmark -q -n 1000000 --threads 64
Comment From: filipecosta90
Hi there @academe-01, trying to reproduce as follow:
# spin server
taskset -c 0 `pwd`/src/redis-server --logfile redis-opt.log --save "" --daemonize yes

# benchmark
taskset -c 1-3 redis-benchmark --csv -n 1000000 --threads 3
I was able to measure ~=3.7% overhead, which was described/justified before in https://github.com/redis/redis/issues/10460
due to the following features:
| Funtion | %CPU time | Note |
|---|---|---|
| updateClientMemUsage | 1.50% | (after the improvement of #10401 ) |
| ACLCheckAllUserCommandPerm | 1.20% | #9974 |
| updateCommandLatencyHistogram (can be disabled) | 0.80% | #9462 |
Heres the benchmark table shared on a run on my local lab (notice that ideally we should run this for longer and multiple time) :
| test | v6.2.7 | v7.0.3 | % change |
|---|---|---|---|
| PING_INLINE | 148126 | 142837 | -3.6% |
| PING_MBULK | 153822 | 148126 | -3.7% |
| SET | 148126 | 142837 | -3.6% |
| GET | 153822 | 148148 | -3.7% |
| INCR | 153822 | 148148 | -3.7% |
| LPUSH | 142837 | 142837 | 0.0% |
| RPUSH | 148126 | 142837 | -3.6% |
| LPOP | 148148 | 142837 | -3.6% |
| RPOP | 148148 | 142857 | -3.6% |
| SADD | 148148 | 142857 | -3.6% |
| HSET | 148104 | 142837 | -3.6% |
| SPOP | 153822 | 148126 | -3.7% |
| ZADD | 142837 | 137931 | -3.4% |
| ZPOPMIN | 153799 | 148148 | -3.7% |
| LPUSH (needed to benchmark LRANGE) | 142837 | 142837 | 0.0% |
| LRANGE_100 (first 100 elements) | 83306 | 76894 | -7.7% |
| LRANGE_300 (first 300 elements) | 41639 | 37709 | -9.4% |
| LRANGE_500 (first 500 elements) | 27742 | 24807 | -10.6% |
| LRANGE_600 (first 600 elements) | 23776 | 21235 | -10.7% |
| MSET (10 keys) | 108073 | 105241 | -2.6% |
One interesting thing is that the LRANGE tests are presenting a larger drop. I'll check this with more detail during the following days and report back.
Comment From: academe-01
Hi @filipecosta90,
my tests were made with with rdb disabled (save "") and I always pin redis to specific cores/numa nodes.
Sorry I didn't mention it before.
Also I have io-threads 8
Please re-run your tests using more threads/cores.
Comment From: sundb
hi @filipecosta90 @academe-01
It's werid that when I test the commands provided by filipecosta90, the result of LRANGE* tests sometimes in unstale are more faster than v6.2.7.
unstable
"LPUSH (needed to benchmark LRANGE)","10395.88","4.490","1.384","4.191","6.031","6.783","13.863"
"LRANGE_100 (first 100 elements)","9979.64","4.637","1.272","4.383","6.223","6.927","12.503"
"LRANGE_300 (first 300 elements)","9132.25","4.962","1.336","4.815","6.639","7.343","11.495"
"LRANGE_500 (first 500 elements)","8176.08","5.485","1.040","5.343","7.487","8.791","39.519"
"LRANGE_600 (first 600 elements)","7821.91","5.706","1.320","5.583","7.799","8.991","22.191"
6.2.7
"LRANGE_100 (first 100 elements)","9807.77","4.715","1.088","4.487","6.463","7.591","25.087"
"LRANGE_300 (first 300 elements)","9070.29","4.986","1.216","4.823","6.807","7.871","23.663"
"LRANGE_500 (first 500 elements)","8452.01","5.292","1.016","5.143","7.271","8.479","34.591"
"LRANGE_600 (first 600 elements)","7947.23","5.612","1.272","5.415","7.943","9.735","39.999"
Comment From: filipecosta90
hi @filipecosta90 @academe-01 It's werid that when I test the commands provided by filipecosta90, the result of
LRANGE*tests sometimes in unstale are more faster than v6.2.7. unstable
"LPUSH (needed to benchmark LRANGE)","10395.88","4.490","1.384","4.191","6.031","6.783","13.863"
"LRANGE_100 (first 100 elements)","9979.64","4.637","1.272","4.383","6.223","6.927","12.503"
"LRANGE_300 (first 300 elements)","9132.25","4.962","1.336","4.815","6.639","7.343","11.495"
"LRANGE_500 (first 500 elements)","8176.08","5.485","1.040","5.343","7.487","8.791","39.519"
"LRANGE_600 (first 600 elements)","7821.91","5.706","1.320","5.583","7.799","8.991","22.191"
6.2.7
"LRANGE_100 (first 100 elements)","9807.77","4.715","1.088","4.487","6.463","7.591","25.087"
"LRANGE_300 (first 300 elements)","9070.29","4.986","1.216","4.823","6.807","7.871","23.663"
"LRANGE_500 (first 500 elements)","8452.01","5.292","1.016","5.143","7.271","8.479","34.591"
"LRANGE_600 (first 600 elements)","7947.23","5.612","1.272","5.415","7.943","9.735","39.999"
@sundb notice that on unstable we have https://github.com/redis/redis/pull/10697, which is not present on v7.0.3 if I'm not mistaken.
Comment From: oranagra
@filipecosta90 #10697 does exist in v7.0.3. at the time 7.0.3 was release, everything in unstable was included in it.
Comment From: oranagra
@filipecosta90 one thing i'm still puzzled about is how it is related to #10987. IIUC it's just that while you investigated this issue you came across that opportunity. do we know the reason for the regression reported here?
Comment From: filipecosta90
@filipecosta90 one thing i'm still puzzled about is how it is related to #10987. IIUC it's just that while you investigated this issue you came across that opportunity.
yes. given I focused on LRANGE benchmarks due to the higher diff I bumped into #10987
do we know the reason for the regression reported here?
The following 7.0 features are know to take some CPU:
| Funtion | %CPU time | Note |
|---|---|---|
| updateClientMemUsage | 1.50% | (after the improvement of #10401 ) |
| ACLCheckAllUserCommandPerm | 1.20% | #9974 |
| updateCommandLatencyHistogram (can be disabled) | 0.80% | #9462 |
but there is still a GAP to understand. I'm working on it
Comment From: wenglingmei
I run the redis-benchmark with -t lrange for 6.2.7 and 7.0.3 with a customized gprof. It samples variables while profiling. I notice the main difference is in function lookupKey in db.c. The samples on the variable key are dramatically different. All samples from 7.0.3 are zeroed. I attached the files here. Maybe they could help explain the performance degradation. lookupKey_val_6.2.7.txt lookupKey_val_7.0.2.txt
Comment From: oranagra
@wenglingmei i don't understand what you mean by "customized gprof", and what are "samples on the variable key"
Comment From: wenglingmei
@wenglingmei i don't understand what you mean by "customized gprof", and what are "samples on the variable key"
Hi @oranagra, thank you for the reply. I should have mentioned the customized gprof is my research project implemented based on gprof. To be simple, if you check the file, I recorded the value of the variable "key", which is the parameter in function "lookupKey" defined in src/db.c line 66 in redis-6.2.7.
In this test, many more variables including the parameter "key". My tool marks its values as a major difference between the two versions. If you want more detail, I would be happy to post it here.
Comment From: oranagra
@wenglingmei i'm still not sure i understand what it does, in the 7.0.3 report we see it reports line 1691 and 1683 (not about lookupKey and no access to the "key" variable). could it simply be that there was some refactoring, and we added more wrapper functions around lookupKey, and / or an argument named key is mentioned more?
Comment From: wenglingmei
~~@oranagra, we apply some techniques to collect local variables even though the function has called into its callees. We noticed the function "expireIfNeeded" is moved into the function "lookupKey" from the lookupKey() family. Because we also sample the functions of the lookupKey() family, e.g., "lookupKeyReadWithFlags", the values of variables "key" from them and their callee are also recorded( I did not paste them to the text file in the previous comment).~~
~~Considering all the values of the "key" from all the functions, In 6.2.7, still much fewer value samples of the "key" are zero compares to the one in 7.0.3. I wondered if the code refactoring increases the frequency of deleting a key for the benchmark.~~
Just check the benchmark source code and realize the keys are not attached with expiration time. Sorry for the 'stupid' guess. I will explore more components other than db.c.
Comment From: FZambia
Hello, I also observed a performance drop when comparing Redis 6.2.7 with Redis 7.0.5 on MacOS (M1, arm64). I am running my Go application benchmarks:
> benchstat redis_6.txt redis_7.txt
name                      old time/op    new time/op    delta
RedisPublish_History-8    10.3µs ± 0%    13.3µs ± 1%  +28.74%  (p=0.008 n=5+5)
RedisAddPresence-8        3.67µs ± 3%    5.34µs ± 0%  +45.54%  (p=0.008 n=5+5)
So overall operation latency drop is significant.
- RedisPublish_History - executes LUA script which contains several different commands (XADD, PUBLISH, EXPIRE, HSET, EXISTS)
- RedisAddPresence - LUA with ZADD, HSET, EXPIRE
The benchmarking code is the same, the only difference is Redis server version benchrmarks are launched with.
In the case above Redis CPU usage was up to 100% during the load. I also decreased the load from the app to keep Redis under 100% CPU – and results are like this:
❯ benchstat redis_6.txt redis_7.txt
name                                old time/op    new time/op    delta
RedisPublish_History-8    11.3µs ± 0%    15.4µs ± 0%  +35.94%  (p=0.008 n=5+5)
RedisAddPresence-8        4.80µs ± 0%    7.06µs ± 0%  +47.02%  (p=0.008 n=5+5)
Also, worse in Redis 7 case.
Redis launched like this (6.2.7):
/opt/homebrew/opt/redis@6.2/bin/redis-server --save ""
And like this (7.0.5):
redis-server --save ""
Comment From: oranagra
@FZambia that's a pretty big difference which we didn't see in our own tests, can you maybe help us narrow it down? maybe by running redis-benchmark against your servers to see if it exposes it, and if not, try to reduce your workload to a minimal one that exposes it. how did you obtain / build these two servers? maybe this is a result of a different build setup / configuration?
Comment From: FZambia
Since I am using LUA scripts then possibly the latency degradation is somehow related to them?
Running this:
redis-benchmark -n 1000000 eval 'redis.call("hset", "h1", "k", "v");redis.call("hset", "h2", "k", "v");redis.call("expire", "h1", 3600);redis.call("expire", "h2", 3600);return redis.call("ping")' 0
On Redis 6:
Summary:
  throughput summary: 175254.12 requests per second
  latency summary (msec):
          avg       min       p50       p95       p99       max
        0.238     0.080     0.239     0.327     0.367     2.199
On Redis 7:
Summary:
  throughput summary: 126566.26 requests per second
  latency summary (msec):
          avg       min       p50       p95       p99       max
        0.347     0.080     0.343     0.431     0.487     2.847
how did you obtain / build these two servers?
Both Redis versions installed from brew in my case (M1, arm64). Don't have access to Linux these days, possibly on Linux benchmarks may produce better results? If yes - then degradation on Darwin is not really a thing for me.
Comment From: sundb
@FZambia Use git bisect to determine and found that this performance degradation is caused by https://github.com/redis/redis/pull/10220
Comment From: oranagra
@sundb i guess you mean that you already used bisect and found the offensive commit? i'm guessing this is related to the old optimization that this commit removed, but it's odd since @yoav-steinberg did post a benchmark showing it didn't have any impact.
Comment From: FZambia
I tried to run my app benchmarks with Redis before #10220 and after, building Redis from source. Results are:
❯ benchstat before.txt after.txt
name                  old time/op    new time/op    delta
RedisAddPresence-8    4.65µs ± 0%    5.12µs ± 1%  +10.31%  (p=0.000 n=9+9)
So it definitely affected latency, but it's not the only source of the degradation I suppose, as for Redis 6.2.7 I observed 3.6µs of latency in my benchmarks. Unfortunately, can not build Redis from source from 6.2.7 tag on M1 ARM64 to confirm that latency observed from Redis 6.2.7 installed from brew, getting:
    CC adlist.o
    CC quicklist.o
    CC ae.o
    CC anet.o
    CC dict.o
make[1]: *** No rule to make target `functions.h', needed by `server.o'.  Stop.
Comment From: FZambia
For redis-benchmark I previously sent:
redis-benchmark -n 1000000 eval 'redis.call("hset", "h1", "k", "v");redis.call("hset", "h2", "k", "v");redis.call("expire", "h1", 3600);redis.call("expire", "h2", 3600);return redis.call("ping")' 0
Before #10220:
Summary:
  throughput summary: 149499.17 requests per second
  latency summary (msec):
          avg       min       p50       p95       p99       max
        0.289     0.080     0.287     0.375     0.415     3.039
After:
Summary:
  throughput summary: 138293.45 requests per second
  latency summary (msec):
          avg       min       p50       p95       p99       max
        0.316     0.080     0.319     0.391     0.439     2.463
So it's slower, but again – it seems the overall difference between 6.2.7 and 7.0.5 accumulated with some other commits.
Comment From: oranagra
@FZambia the reason you failed to build 6.2.7 was that when switching between branches, you often have to do make distclean
i think it is important to compare thins that were built the same way, so that we rule out unexpected difference due to different build environments / flags.
I was also able to reproduce a big performance difference between 7.0 and 6.2 using your benchmark line (on x86_64 Linux).
And didn't a similar big difference when testing the before and after of #10220.
p.s. i think it's better to add -P 10 so that we are sure to measure the speed of redis and not the network / client round-trip latency.
Comment From: FZambia
the reason you failed to build 6.2.7 was that when switching between branches, you often have to do make distclean
This helped, thanks!
For my Go app benchmark
6.2.7: 3.6µs latency before #10220: 4.7µs after #10220: 5.2µs 7.0.5: 5.1µs
For redis-benchmark
For redis-benchmark -n 1000000 -P 10 eval 'redis.call("hset", "h1", "k", "v");redis.call("hset", "h2", "k", "v");redis.call("expire", "h1", 3600);redis.call("expire", "h2", 3600);return redis.call("ping")' 0:
6.2.7:
Summary:
  throughput summary: 315059.84 requests per second
  latency summary (msec):
          avg       min       p50       p95       p99       max
        1.529     0.568     1.519     1.631     2.015     5.919
before #10220:
Summary:
  throughput summary: 229515.73 requests per second
  latency summary (msec):
          avg       min       p50       p95       p99       max
        2.120     0.896     2.111     2.207     2.551     8.015
after #10220:
Summary:
  throughput summary: 207641.20 requests per second
  latency summary (msec):
          avg       min       p50       p95       p99       max
        2.348     1.120     2.335     2.447     2.751     8.535
7.0.5:
  throughput summary: 191681.05 requests per second
  latency summary (msec):
          avg       min       p50       p95       p99       max
        2.538     0.912     2.535     2.631     2.895     8.775
As we can see latency just becoming worse as time goes, and #10220 is not the only reason for it.
Comment From: filipecosta90
@FZambia / @oranagra I've added this benchmark to the redis benchmarks SPEC and in the next couple of hours we will have the profile info and numbers about 6.2.7 and 7.0.* version to detect where the issue is coming from and try to address it.
https://github.com/redis/redis-benchmarks-specification/blob/main/redis_benchmarks_specification/test-suites/memtier_benchmark-2keys-lua-eval-hset-expire.yml
I will follow up on this with more data tomorrow.
Comment From: sundb
@oranagra @filipecosta90 It seems to be related to the following two commits about argv caches being removed.
https://github.com/redis/redis/commit/48c49c485155ba9e4a7851fd1644c171674c6f0f
https://github.com/redis/redis/commit/4f686555ce962e6632235d824512ea8fdeda003c
before #10220
10220
Comment From: oranagra
How does that sit with the previous statement that the majority of the degradation from 6.2 was before #10220? And the benchmark in the PR that shows the optimization doesn't contribute much?
Comment From: filipecosta90
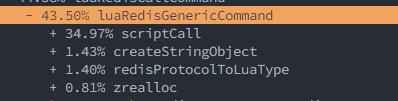
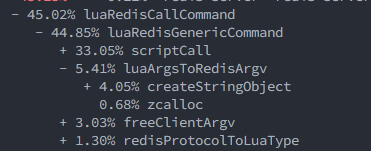
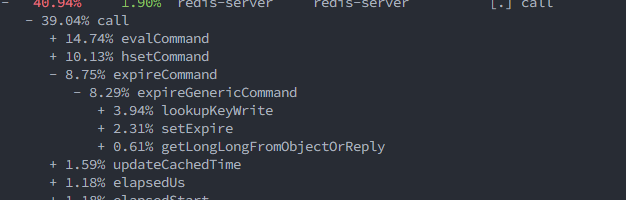
@sundb it seems that some of the degradation (half of it) is being caused by us calling 2x the evalCalcFunctionName when not required. It bumped 10% the numbers in unstable.
WRT argv caches being removed I also see:
- + 3.21% luaArgsToRedisArgv
- + 1.73% freeClientArgv
Indeed it might be worthed to reintroduce if possible that optimization @oranagra / @yoav-steinberg
Comment From: sundb
@filipecosta90 It's better to change the benchmark command to redis-benchmark -n 1000000 -P 10 eval 'redis.call("hset", "h1", "k", "v");redis.call("hset", "h2", "k", "v");return redis.call("ping")' 0.
8474 affacts the EXPIRE command, resulting in ~%10 reduction in benchmark performance.
This is mainly due to the consumption of rewriteClientCommandVector in #8474
8474: P50=2.239
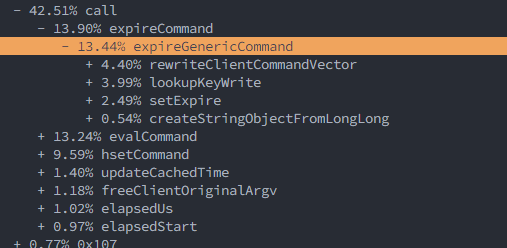
before #8474: P50=2.479
Comment From: sundb
~#8015 results in 15% performance degration.~
~Since server.repl_backlog will be created even if there is no slave, all commands propagate will be wasted.~
~ping @soloestoy~
Already fixed in #9166
Comment From: filipecosta90
Already fixed in #9166
This means we just need to re-enable argv caches correct? @sundb / @oranagra / @yoav-steinberg do you want me to try that on #11521?
Comment From: sundb
@filipecosta90 There are other modifications that can have performance degradation, but they may be unavoidable.
9819 -~1.5%
9780 -~3
I need more work to check.
Comment From: oranagra
This means we just need to re-enable argv caches correct? @sundb / @oranagra / @yoav-steinberg do you want me to try that on #11521?
yes, if we see that this optimization had value, let's bring it back. i guess we better do that in a separate PR (since they're unrelated, no need to delay the first one)
Comment From: filipecosta90
@FZambia after https://github.com/redis/redis/pull/11521 merge this is the current status of unstable branch.
Results based on OSS standalone achievable ops/sec
| COMMAND | 6.2.6 | unstable | unstable after https://github.com/redis/redis/pull/11521 | % Improvement vs old unstable | % Drop vs 6.2.6 |
|---|---|---|---|---|---|
| EVAL | 223744 | 169767 | 187298 | 10.33% | -16.29% |
as being discussed with @oranagra we're now checking further points of improvement.
Comment From: filipecosta90
@FZambia doing a status point of what was improved since 7.0.5 until now WRT to EVAL/EVALSHA: - https://github.com/redis/redis/pull/11556 - https://github.com/redis/redis/pull/11541 - https://github.com/redis/redis/pull/11521
by using the following two benchmarks:
setup
redis-cli SCRIPT load "redis.call('hset', 'h1', 'k', 'v');redis.call('hset', 'h2', 'k', 'v');return redis.call('ping')"
benchmark commands
# benchmark EVAL
memtier_benchmark --command="eval \"redis.call('hset', 'h1', 'k', 'v');redis.call('hset', 'h2', 'k', 'v');return redis.call('ping')\" 0"  - --hide-histogram --test-time 180 --pipeline 10 -x 3

# benchmark EVALSHA
emtier_benchmark --command="EVALSHA 7cecb99fd9091d8e66d5cccf8979cf3aec5c4951 0"  - --hide-histogram --test-time 180 --pipeline 10 -x 3
we get the following results:
| COMMAND | 6.2.7 | 7.0.5 | unstable ( c0267b3fa5808df475dec83c956b9a2bec112b90 ) | % Improvement vs 7.0.5 | % change vs 6.2.7 |
|---|---|---|---|---|---|
| EVAL | 291028 | 214094 | 292273 | 36.5% | 0.4% |
| EVALSHA | 351570 | 264787 | 330040 | 24.6% | -6.1% |
can you confirm on your side that unstable will get you to 6.2.7 levels?
Comment From: FZambia
Hello @filipecosta90, thanks for the update. I just checked my numbers, they do not correspond yours unfortunately, though the improvement is notable (I am on arm M1 Mac btw).
Redis-benchmark:
redis-benchmark -n 1000000 -P 10 eval 'redis.call("hset", "h1", "k", "v");redis.call("hset", "h2", "k", "v");redis.call("expire", "h1", 3600);redis.call("expire", "h2", 3600);return redis.call("ping")' 0
6.2.7: 318572 rps 7.0.5: 191460 rps Unstable: 252780 rps
My app bench which executes LUA (with EVALSHA):
6.2.7: 3527 ns/op 7.0.5: 5204 ns/op Unstable: 4486 ns/op
Comment From: filipecosta90
Hello @filipecosta90, thanks for the update. I just checked my numbers, they do not correspond yours unfortunately, though the improvement is notable (I am on arm M1 Mac btw).
Redis-benchmark:
redis-benchmark -n 1000000 -P 10 eval 'redis.call("hset", "h1", "k", "v");redis.call("hset", "h2", "k", "v");redis.call("expire", "h1", 3600);redis.call("expire", "h2", 3600);return redis.call("ping")' 06.2.7: 318572 rps 7.0.5: 191460 rps Unstable: 252780 rps
My app bench which executes LUA (with EVALSHA):
6.2.7: 3527 ns/op 7.0.5: 5204 ns/op Unstable: 4486 ns/op
let me confirm the gap you're seeing is now related to expire command and that the rest is ok now. will update back 👍
Comment From: FZambia
redis-benchmark without expire on my machine:
6.2.7: 428082.19 7.0.5: 280269.06 Unstable: 408830.72
Comment From: filipecosta90
@academe-01 / @oranagra / @FZambia as a follow up of the intial PR comment I've re-run the default redis-benchmark test suite comparing the current unstable branch vs 6.2.7. This is repeatable as follow:
taskset -c 1-3 redis-benchmark --csv -n 1000000 --threads 3
Looking at the achievable ops/sec we can confirm that there is no regression on unstable vs 6.2. Furthermore we can confirm the opposite given the work that has been applied in optimizing the commands/reply/etc...
| test | Version 6.2.7 | unstable branch 7th December 2022 ( c0267b3fa5808df475dec83c956b9a2bec112b90 ) | % Improvement unstable vs 6.2.7 |
|---|---|---|---|
| PING_INLINE | 181785 | 181818 | 0.0% |
| PING_MBULK | 181785 | 181785 | 0.0% |
| SET | 173883 | 173883 | 0.0% |
| GET | 181818 | 181785 | 0.0% |
| INCR | 181785 | 181818 | 0.0% |
| LPUSH | 173913 | 173883 | 0.0% |
| RPUSH | 173913 | 173883 | 0.0% |
| LPOP | 173883 | 173883 | 0.0% |
| RPOP | 173883 | 173913 | 0.0% |
| SADD | 181785 | 181818 | 0.0% |
| HSET | 173883 | 173913 | 0.0% |
| SPOP | 181818 | 181818 | 0.0% |
| ZADD | 173883 | 173913 | 0.0% |
| ZPOPMIN | 181785 | 181818 | 0.0% |
| LPUSH (needed to benchmark LRANGE) | 173883 | 173883 | 0.0% |
| LRANGE_100 (first 100 elements) | 95220 | 105241 | 10.5% |
| LRANGE_300 (first 300 elements) | 49978 | 57123 | 14.3% |
| LRANGE_500 (first 500 elements) | 33872 | 39579 | 16.8% |
| LRANGE_600 (first 600 elements) | 29166 | 34160 | 17.1% |
| MSET (10 keys) | 124969 | 129016 | 3.2% |
I suggest we keep digging on the missing explanation for the EXPIRE overhead and then, ( as soon we resolve that EXPIRE regression raised on the EVAL benchmark ), close this open issue.
Comment From: filipecosta90
@FZambia after #11602 here's the status of EXPIRE command. We're with a 5% GAP vs 6.2.7 =)
| test | Version 6.2.7 | unstable branch 9th December 2022 ( 528bb11d7a25cde99e6d48c418662575c64758b2 ) | % change unstable vs 6.2.7 |
|---|---|---|---|
| EXPIRE ( pipeline 10 ) | 876843 | 830212 | -5.3% |
Comment From: FZambia
Tried the unstable (from 20854cb6109c23e65dca0174517f3861a55cb694 which is latest commit at this point), again - a notable improvement, thanks a lot for your work on it. I can't say it's now comparable to 6.2.7 though:
Redis-benchmark:
redis-benchmark -n 1000000 -P 10 eval 'redis.call("hset", "h1", "k", "v");redis.call("hset", "h2", "k", "v");redis.call("expire", "h1", 3600);redis.call("expire", "h2", 3600);return redis.call("ping")' 0
6.2.7: 313185 rps Unstable: 252780 -> 282007 rps (i.e. increased from 252780 rps in my previous comment above to 282007 rps)
My app bench which executes LUA (with EVALSHA):
6.2.7: 3527 ns/op Unstable: 4486 -> 4329 ns/op
For the reference, LUA script in my app is this one:
redis.call("zadd", KEYS[1], ARGV[2], ARGV[3])
redis.call("hset", KEYS[2], ARGV[3], ARGV[4])
redis.call("expire", KEYS[1], ARGV[1])
redis.call("expire", KEYS[2], ARGV[1])
Comment From: wenglingmei
The two versions have heavy code refraction. I investigated more functions ranked by our comparing tools. We find the difference in the function clientHasPendingReplies contributes to the performance regression. $ taskset -c 1-3 /path/to/redis-6.2.7/redis/src/redis-benchmark -t lrange_600 --csv -n 1000000 --threads 3
======================================================== redis-6.2.7
"test","rps","avg_latency_ms","min_latency_ms","p50_latency_ms","p95_latency_ms","p99_latency_ms","max_latency_ms" "LPUSH (needed to benchmark LRANGE)","266666.66","0.177","0.024","0.175","0.223","0.351","2.007" "LRANGE_600 (first 600 elements)","49972.52","0.795","0.096","0.799","0.975","0.999","1.495"
"test","rps","avg_latency_ms","min_latency_ms","p50_latency_ms","p95_latency_ms","p99_latency_ms","max_latency_ms" "LPUSH (needed to benchmark LRANGE)","222172.86","0.211","0.024","0.207","0.263","0.415","2.655" "LRANGE_600 (first 600 elements)","48164.92","0.827","0.048","0.807","1.239","1.519","9.415"
"test","rps","avg_latency_ms","min_latency_ms","p50_latency_ms","p95_latency_ms","p99_latency_ms","max_latency_ms" "LPUSH (needed to benchmark LRANGE)","266595.59","0.178","0.024","0.175","0.231","0.351","2.159" "LRANGE_600 (first 600 elements)","49972.52","0.793","0.048","0.799","0.967","1.007","7.695"
======================================================== redis-7.0.3
"test","rps","avg_latency_ms","min_latency_ms","p50_latency_ms","p95_latency_ms","p99_latency_ms","max_latency_ms" "LPUSH (needed to benchmark LRANGE)","222172.86","0.218","0.024","0.215","0.271","0.431","2.583" "LRANGE_600 (first 600 elements)","39183.42","1.049","0.048","1.047","1.527","1.759","2.471"
"test","rps","avg_latency_ms","min_latency_ms","p50_latency_ms","p95_latency_ms","p99_latency_ms","max_latency_ms" "LPUSH (needed to benchmark LRANGE)","222172.86","0.217","0.024","0.215","0.271","0.431","2.615" "LRANGE_600 (first 600 elements)","40374.68","0.995","0.048","1.015","1.287","1.551","2.567"
"test","rps","avg_latency_ms","min_latency_ms","p50_latency_ms","p95_latency_ms","p99_latency_ms","max_latency_ms" "LPUSH (needed to benchmark LRANGE)","250000.00","0.184","0.016","0.175","0.239","0.367","2.183" "LRANGE_600 (first 600 elements)","40779.71","1.011","0.072","1.023","1.231","1.527","2.207"
======================================================== redis-7.0.3-patched in src/networking.c
1173c1173 \< if (false && getClientType(c) == CLIENT_TYPE_SLAVE) { > if (getClientType(c) == CLIENT_TYPE_SLAVE) {
"test","rps","avg_latency_ms","min_latency_ms","p50_latency_ms","p95_latency_ms","p99_latency_ms","max_latency_ms" "LPUSH (needed to benchmark LRANGE)","266595.59","0.183","0.024","0.175","0.231","0.359","2.167" "LRANGE_600 (first 600 elements)","43440.48","0.880","0.048","0.911","1.111","1.151","1.959"
"test","rps","avg_latency_ms","min_latency_ms","p50_latency_ms","p95_latency_ms","p99_latency_ms","max_latency_ms" "LPUSH (needed to benchmark LRANGE)","266595.59","0.181","0.024","0.175","0.231","0.359","1.967" "LRANGE_600 (first 600 elements)","43925.15","0.935","0.080","0.943","1.111","1.143","1.751"
"test","rps","avg_latency_ms","min_latency_ms","p50_latency_ms","p95_latency_ms","p99_latency_ms","max_latency_ms" "LPUSH (needed to benchmark LRANGE)","266595.59","0.181","0.016","0.175","0.231","0.359","1.967" "LRANGE_600 (first 600 elements)","43451.81","0.943","0.080","0.951","1.127","1.159","1.871"
I am new to the code base of redis and hope you are willing to verify the findings.
Comment From: sundb
@wenglingmei Please note that all the optimization for this issue is from 7.0.6, so you should compare between 6.2.7 and 7.0.6(or unstable). No performance degradation from my local PC. unstable
"LRANGE_600 (first 600 elements)","34741.52","0.942","0.072","0.863","1.743","2.263","7.391"
6.2.7
"LRANGE_600 (first 600 elements)","31955.01","1.115","0.072","1.055","1.991","2.535","5.167"
Comment From: wenglingmei
@sundb I notice the improvement in the unstable branch. My purpose is to figure out the performance gaps. It could also be potential to optimize more in new versions. Just a quick test of the same patch on the unstable in my machine.
unstable: "LRANGE_600 (first 600 elements)","54027.77","0.724","0.048","0.727","0.911","0.959","2.055"
unstable with patch: "LRANGE_600 (first 600 elements)","60573.02","0.583","0.040","0.583","0.847","0.991","2.063"
Comment From: sundb
@wenglingmei But the patch doesn't make sense, it just forces it out, but this piece of code is necessary unless we can speed up getClientType().
BTW, getClientType() was optimized in #10697.
I had also thought about optimizing it but failed.
Comment From: wenglingmei
@sundb it is clear to me. The patch is not meant to patch, just for verification.
Comment From: mjobin-mdsol
Can we have fresh benchmarks with 7.0.11 to be sure the regression has been fixed?
Comment From: Cherry
We were also seeing some major performance regressions after upgrading to Redis 7. Today, we bumped to 7.0.11 and things seem to have returned to what they were previously.
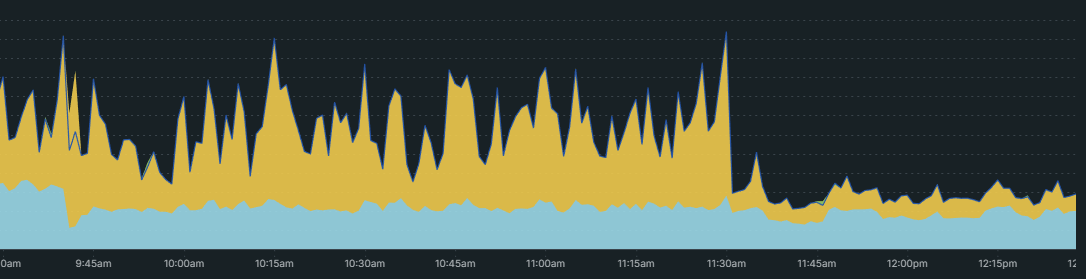
In the graph above, yellow is time spent in Redis. You can see exactly when Redis was upgraded. 😅
Comment From: filipecosta90
@Cherry / @FZambia given the above should we close this one? cc @oranagra / @yossigo / @madolson
Comment From: mjobin-mdsol
@Cherry Can you confirm from which version you have upgraded to 7.0.11 please?
Comment From: FZambia
@filipecosta90 hello! In my comment I pointed that while things were drastically improved the regression is still there - sth like 15%. I am running benches on M1 ARM though. And looks like there were some additional optimizations since then.
Could you please run the following on Linux machine with 6.2.7 and 7.0.11?
redis-benchmark -n 1000000 -P 10 eval 'redis.call("hset", "h1", "k", "v");redis.call("hset", "h2", "k", "v");redis.call("expire", "h1", 3600);redis.call("expire", "h2", 3600);return redis.call("ping")' 0
If the difference is negligible then good to close from my point of view. Many thanks for working on this to all the team.
Comment From: mjobin-mdsol
look forward to the results from a Linux machine
Comment From: FZambia
Finally was able to launch the above benchmark on Linux machine. I.e.:
./redis-benchmark -n 1000000 -P 10 eval 'redis.call("hset", "h1", "k", "v");redis.call("hset", "h2", "k", "v");redis.call("expire", "h1", 3600);redis.call("expire", "h2", 3600);return redis.call("ping")' 0
On Debian 12:
Linux debian-c-4-8gib-ams3-01 6.1.0-9-amd64 #1 SMP PREEMPT_DYNAMIC Debian 6.1.27-1 (2023-05-08) x86_64 GNU/Linux
Compared 6.2.14 with 7.2.3.
Redis 6.2.14:
  1000000 requests completed in 5.99 seconds
  50 parallel clients
  190 bytes payload
  keep alive: 1
  host configuration "save":
  host configuration "appendonly": no
  multi-thread: no

Latency by percentile distribution:
0.000% <= 0.463 milliseconds (cumulative count 10)
50.000% <= 3.055 milliseconds (cumulative count 504340)
75.000% <= 3.239 milliseconds (cumulative count 757960)
87.500% <= 3.351 milliseconds (cumulative count 875820)
93.750% <= 3.447 milliseconds (cumulative count 938310)
96.875% <= 3.527 milliseconds (cumulative count 968750)
98.438% <= 3.599 milliseconds (cumulative count 984380)
99.219% <= 3.671 milliseconds (cumulative count 992830)
99.609% <= 3.735 milliseconds (cumulative count 996200)
99.805% <= 3.823 milliseconds (cumulative count 998080)
99.902% <= 3.967 milliseconds (cumulative count 999060)
99.951% <= 7.583 milliseconds (cumulative count 999520)
99.976% <= 7.943 milliseconds (cumulative count 999760)
99.988% <= 9.215 milliseconds (cumulative count 999880)
99.994% <= 9.319 milliseconds (cumulative count 999940)
99.997% <= 9.407 milliseconds (cumulative count 999970)
99.998% <= 9.471 milliseconds (cumulative count 999990)
99.999% <= 9.519 milliseconds (cumulative count 1000000)
100.000% <= 9.519 milliseconds (cumulative count 1000000)

Cumulative distribution of latencies:
0.000% <= 0.103 milliseconds (cumulative count 0)
0.002% <= 0.503 milliseconds (cumulative count 20)
0.003% <= 1.007 milliseconds (cumulative count 30)
0.005% <= 1.103 milliseconds (cumulative count 50)
0.018% <= 1.207 milliseconds (cumulative count 180)
0.113% <= 1.303 milliseconds (cumulative count 1130)
0.268% <= 1.407 milliseconds (cumulative count 2680)
0.379% <= 1.503 milliseconds (cumulative count 3790)
0.603% <= 1.607 milliseconds (cumulative count 6030)
1.230% <= 1.703 milliseconds (cumulative count 12300)
6.871% <= 1.807 milliseconds (cumulative count 68710)
13.075% <= 1.903 milliseconds (cumulative count 130750)
17.253% <= 2.007 milliseconds (cumulative count 172530)
18.641% <= 2.103 milliseconds (cumulative count 186410)
57.230% <= 3.103 milliseconds (cumulative count 572300)
99.937% <= 4.103 milliseconds (cumulative count 999370)
99.950% <= 5.103 milliseconds (cumulative count 999500)
99.978% <= 8.103 milliseconds (cumulative count 999780)
99.980% <= 9.103 milliseconds (cumulative count 999800)
100.000% <= 10.103 milliseconds (cumulative count 1000000)

Summary:
  throughput summary: 166917.03 requests per second
  latency summary (msec):
          avg       min       p50       p95       p99       max
        2.878     0.456     3.055     3.479     3.647     9.519
Redis 7.2.3:
  1000000 requests completed in 5.67 seconds
  50 parallel clients
  190 bytes payload
  keep alive: 1
  host configuration "save":
  host configuration "appendonly": no
  multi-thread: no

Latency by percentile distribution:
0.000% <= 0.615 milliseconds (cumulative count 10)
50.000% <= 2.775 milliseconds (cumulative count 500140)
75.000% <= 3.031 milliseconds (cumulative count 752090)
87.500% <= 3.207 milliseconds (cumulative count 877650)
93.750% <= 3.343 milliseconds (cumulative count 940440)
96.875% <= 3.447 milliseconds (cumulative count 969700)
98.438% <= 3.543 milliseconds (cumulative count 984700)
99.219% <= 3.647 milliseconds (cumulative count 992290)
99.609% <= 3.815 milliseconds (cumulative count 996170)
99.805% <= 4.439 milliseconds (cumulative count 998060)
99.902% <= 5.183 milliseconds (cumulative count 999030)
99.951% <= 6.503 milliseconds (cumulative count 999520)
99.976% <= 7.455 milliseconds (cumulative count 999760)
99.988% <= 7.599 milliseconds (cumulative count 999880)
99.994% <= 7.703 milliseconds (cumulative count 999940)
99.997% <= 7.767 milliseconds (cumulative count 999970)
99.998% <= 7.807 milliseconds (cumulative count 999990)
99.999% <= 7.839 milliseconds (cumulative count 1000000)
100.000% <= 7.839 milliseconds (cumulative count 1000000)

Cumulative distribution of latencies:
0.000% <= 0.103 milliseconds (cumulative count 0)
0.001% <= 0.703 milliseconds (cumulative count 10)
0.002% <= 0.807 milliseconds (cumulative count 20)
0.015% <= 0.903 milliseconds (cumulative count 150)
0.058% <= 1.007 milliseconds (cumulative count 580)
0.156% <= 1.103 milliseconds (cumulative count 1560)
0.328% <= 1.207 milliseconds (cumulative count 3280)
1.086% <= 1.303 milliseconds (cumulative count 10860)
2.537% <= 1.407 milliseconds (cumulative count 25370)
3.626% <= 1.503 milliseconds (cumulative count 36260)
4.559% <= 1.607 milliseconds (cumulative count 45590)
5.428% <= 1.703 milliseconds (cumulative count 54280)
7.113% <= 1.807 milliseconds (cumulative count 71130)
9.800% <= 1.903 milliseconds (cumulative count 98000)
12.154% <= 2.007 milliseconds (cumulative count 121540)
13.442% <= 2.103 milliseconds (cumulative count 134420)
80.866% <= 3.103 milliseconds (cumulative count 808660)
99.729% <= 4.103 milliseconds (cumulative count 997290)
99.900% <= 5.103 milliseconds (cumulative count 999000)
99.950% <= 6.103 milliseconds (cumulative count 999500)
99.969% <= 7.103 milliseconds (cumulative count 999690)
100.000% <= 8.103 milliseconds (cumulative count 1000000)

Summary:
  throughput summary: 176460.22 requests per second
  latency summary (msec):
          avg       min       p50       p95       p99       max
        2.720     0.608     2.775     3.375     3.607     7.839
Comment From: oranagra
@FZambia, so compared to your previous post, i suppose the difference is that you compare to 7.2 rather than 7.0 (not the M1 architecture or other Macos related build differences). I suppose we can close this issue? i.e. last benchmark shows 5% improvement.
Comment From: FZambia
@oranagra no concerns from my side anymore, thanks a lot to the team for all the improvements