Describe the bug
A succession of key set, key delete will induce a memory leak in corresponding slave - redis cluster
To reproduce
We created a simple redis cluster (3 masters, 3 slaves) in kubernetes, and we started to execute the following
redis-benchmark -n 10000000 --cluster -a $REDIS_PASS eval "redis.call('set','{tag}','bar'); redis.call('del','{tag}')" 0
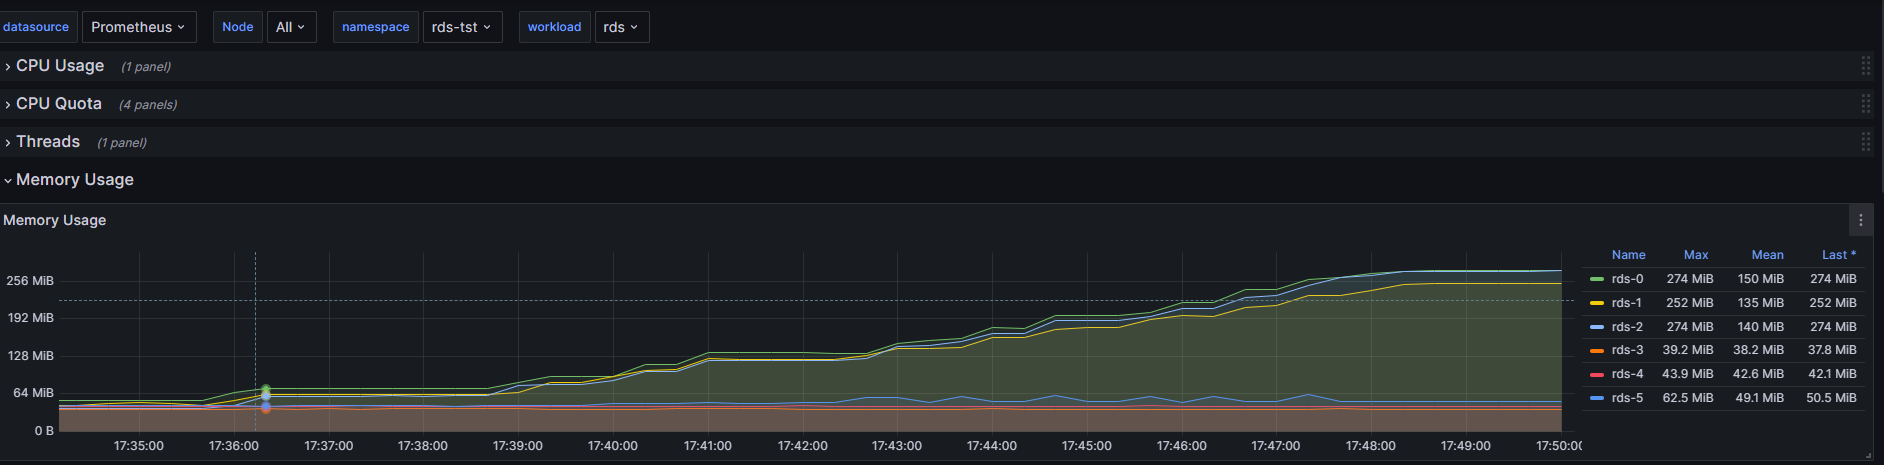
Memory on slaves start to increase as follows:
Expected behavior
No memory leak (which, of course, in time leads to OOM on slaves)
Additional information
Image used for tests: redis/redis-stack-server:7.2.0-v8 (latest)
Command to create the cluster:
redis-cli --cluster create --cluster-replicas 1 rds-0.rds-head.rds-tst:6379 rds-1.rds-head.rds-tst:6379 rds-2.rds-head.rds-tst:6379 rds-3.rds-head.rds-tst:6379 rds-4.rds-head.rds-tst:6379 rds-5.rds-head.rds-tst:6379
Config Map used (redis.conf)
cluster-enabled yes
cluster-require-full-coverage no
cluster-node-timeout 10000
cluster-config-file /data/nodes.conf
cluster-migration-barrier 1
redis-cli - cluster nodes
61a7a22fb16eace27eaf0ff194ce290415935afc rds-1.rds-head.rds-tst:6379@16379 slave 98ab6b8395b6f0f400e32254407e625a38225426 0 1708947356000 9 connected
98ab6b8395b6f0f400e32254407e625a38225426 rds-5.rds-head.rds-tst:6379@16379 master - 0 1708947357341 9 connected 5461-10922
8bb779e9d25b22b5eaddf4502a2b6780b0f88b5f rds-3.rds-head.rds-tst:6379@16379 master - 0 1708947356000 7 connected 10923-16383
f2e2c7476460514d9fe372f680a990292612a0ad rds-4.rds-head.rds-tst:6379@16379 master - 0 1708947356338 8 connected 0-5460
b1e9bc13bcf01229a3f2e034a31e75edb748dac4 rds-2.rds-head.rds-tst:6379@16379 slave 8bb779e9d25b22b5eaddf4502a2b6780b0f88b5f 0 1708947355332 7 connected
b118a156e13a69b5705ff45a538fe5073c0a933d rds-0.rds-head.rds-tst:6379@16379 myself,slave f2e2c7476460514d9fe372f680a990292612a0ad 0 1708947357000 8 connected
redis-cli - info memory - rds-0 (slave)
# Memory
used_memory:230270744
used_memory_human:219.60M
used_memory_rss:244596736
used_memory_rss_human:233.27M
used_memory_peak:230433048
used_memory_peak_human:219.76M
used_memory_peak_perc:99.93%
used_memory_overhead:3005320
used_memory_startup:1924320
used_memory_dataset:227265424
used_memory_dataset_perc:99.53%
allocator_allocated:230510200
allocator_active:237699072
allocator_resident:242221056
total_system_memory:33651826688
total_system_memory_human:31.34G
used_memory_lua:31744
used_memory_vm_eval:31744
used_memory_lua_human:31.00K
used_memory_scripts_eval:0
number_of_cached_scripts:0
number_of_functions:0
number_of_libraries:0
used_memory_vm_functions:32768
used_memory_vm_total:64512
used_memory_vm_total_human:63.00K
used_memory_functions:184
used_memory_scripts:184
used_memory_scripts_human:184B
maxmemory:0
maxmemory_human:0B
maxmemory_policy:noeviction
allocator_frag_ratio:1.03
allocator_frag_bytes:7188872
allocator_rss_ratio:1.02
allocator_rss_bytes:4521984
rss_overhead_ratio:1.01
rss_overhead_bytes:2375680
mem_fragmentation_ratio:1.06
mem_fragmentation_bytes:14346664
mem_not_counted_for_evict:13472
mem_replication_backlog:1066224
mem_total_replication_buffers:1066208
mem_clients_slaves:0
mem_clients_normal:3872
mem_cluster_links:10720
mem_aof_buffer:0
mem_allocator:jemalloc-5.3.0
active_defrag_running:0
lazyfree_pending_objects:0
lazyfreed_objects:0
redis-cli - info memory - rds-4 (its master)
# Memory
used_memory:7882552
used_memory_human:7.52M
used_memory_rss:40910848
used_memory_rss_human:39.02M
used_memory_peak:111359312
used_memory_peak_human:106.20M
used_memory_peak_perc:7.08%
used_memory_overhead:3004128
used_memory_startup:1924448
used_memory_dataset:4878424
used_memory_dataset_perc:81.88%
allocator_allocated:8335704
allocator_active:20381696
allocator_resident:24576000
total_system_memory:33651822592
total_system_memory_human:31.34G
used_memory_lua:40960
used_memory_vm_eval:40960
used_memory_lua_human:40.00K
used_memory_scripts_eval:624
number_of_cached_scripts:4
number_of_functions:0
number_of_libraries:0
used_memory_vm_functions:32768
used_memory_vm_total:73728
used_memory_vm_total_human:72.00K
used_memory_functions:184
used_memory_scripts:808
used_memory_scripts_human:808B
maxmemory:0
maxmemory_human:0B
maxmemory_policy:noeviction
allocator_frag_ratio:2.45
allocator_frag_bytes:12045992
allocator_rss_ratio:1.21
allocator_rss_bytes:4194304
rss_overhead_ratio:1.66
rss_overhead_bytes:16334848
mem_fragmentation_ratio:5.20
mem_fragmentation_bytes:33048968
mem_not_counted_for_evict:13472
mem_replication_backlog:1048592
mem_total_replication_buffers:1066208
mem_clients_slaves:17632
mem_clients_normal:1928
mem_cluster_links:10720
mem_aof_buffer:0
mem_allocator:jemalloc-5.3.0
active_defrag_running:0
lazyfree_pending_objects:0
lazyfreed_objects:0
The DB Size is 0 (zero)
redis-cli -a $REDIS_PASS --cluster call 127.0.0.1:6379 DBSIZE
Warning: Using a password with '-a' or '-u' option on the command line interface may not be safe.
>>> Calling DBSIZE
127.0.0.1:6379: 0
rds-5.rds-head.rds-tst:6379: 0
rds-3.rds-head.rds-tst:6379: 0
rds-0.rds-head.rds-tst:6379: 0
rds-1.rds-head.rds-tst:6379: 0
rds-2.rds-head.rds-tst:6379: 0
Comment From: madolson
So, you aren't using our official OSS redis image. (Image used for tests: redis/redis-stack-server:7.2.0-v8 (latest)) is redis stack, which is not maintained in this repo. I wasn't able to reproduce your issue locally, can you retry with just the redis container and see if you still see the memory leak?
Comment From: druidai-devops
Hi there,
You are right, on redis (no stack) cluster, everything is ok; no memory leak appears.
You can close the request.
Thank you for your time.