Describe the bug
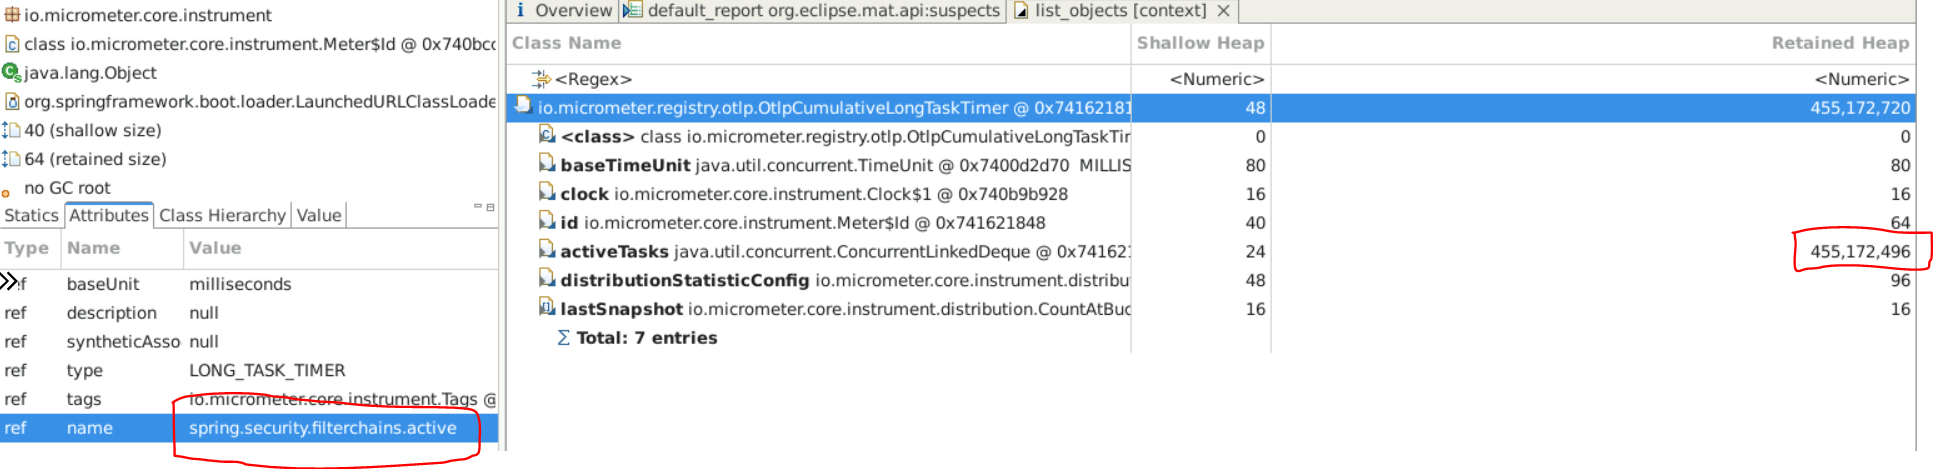
We use Spring Boot version is 3.1.4 with Webflux as well as Spring Cloud Gateway for our application. The metric called spring.security.filterchains.active holds a increasing number of activeTasks in the metric DefaultLongTaskTimer from Micrometer. It seems that the instrumentation from Spring Security does not stop the active tasks such that the number of activeTasks keeps increasing. We have observed more than 8 million activeTasks for this metric. However, we don't have issue with other metrics from Spring Security such as spring.security.authorizations. Please see the screenshots about heapdump analysis below:
This happens in our production environments in which there are relatively high request amount. To Reproduce I tried to reproduce it locally and I have not made it successfully. More information could also be found in this issue https://github.com/micrometer-metrics/micrometer/issues/4221
Expected behavior
Only a small amount of activeTasks are stored for the metric as it only keeps the active requests going through the security filter chains.
Comment From: pengxo
I did the tests locally again and the issue could be reproduced. The value for spring.security.filterchains.active could be increasing (more than 7000 in my tests) even though there are no active requests after some requests. But there is no issue with other metrics from Spring Security. There seems to be some code paths in which the active tasks are not finished.
Comment From: jzheaux
Thanks, @pengxo. Are you able to provide a minimal sample that I can use to reproduce the issue? If so, we'll be able to get to the root of the problem more quickly.
Comment From: pengxo
Hi @jzheaux , I reproduced it locally within our application. I am not sure if I could reproduce it locally with a sample project. It also needs some load. I will try to do that and let you know.
Comment From: FrontierPsychiatrist
Hi,
chiming in to report that I see a similar behavior in our production environment. The memory usage of our application slowly grows, a heap dump shows a lot of ConcurrentLinkedDeque$Node objects that can be traced back to a Micrometer Meter with the name spring.security.filterchains.active.
I can also check if I can gather more information.
I assume, but did not verify that this started with an upgrade from Spring Boot 2.7 -> 3.1.
Comment From: FrontierPsychiatrist
I assume this is somewhere in org.springframework.security.web.server.ObservationWebFilterChainDecorator. When we upgraded from Spring Boot 2.7.9 to 3.1.0 it was introduced, and since then we see the increased memory usage / load (garbage collection I guess). I tried hart to find in there what might go wrong (for sure in simple cases the active tasks are cleaned up) but couldn't find it. In our case there were several hundred thousand of nodes (representing the active tasks)
Comment From: pengxo
Hi @jzheaux , I created a minimal sample project now. I could reproduce the error by creating some load for the endpoint /spring/security/observation/{userId} with basic authentication (see https://github.com/pengxo/sample/blob/main/src/main/java/com/spring/security/observation/issue/sample/SampleSecurityConfig.java). I started some traffic (500 concurrent requests) with Apache JMeter and after some minutes I could see that the active tasks are increasing and it is not 0 when no requests are sent any longer. See my test results from endpoint /actuator/prometheus:
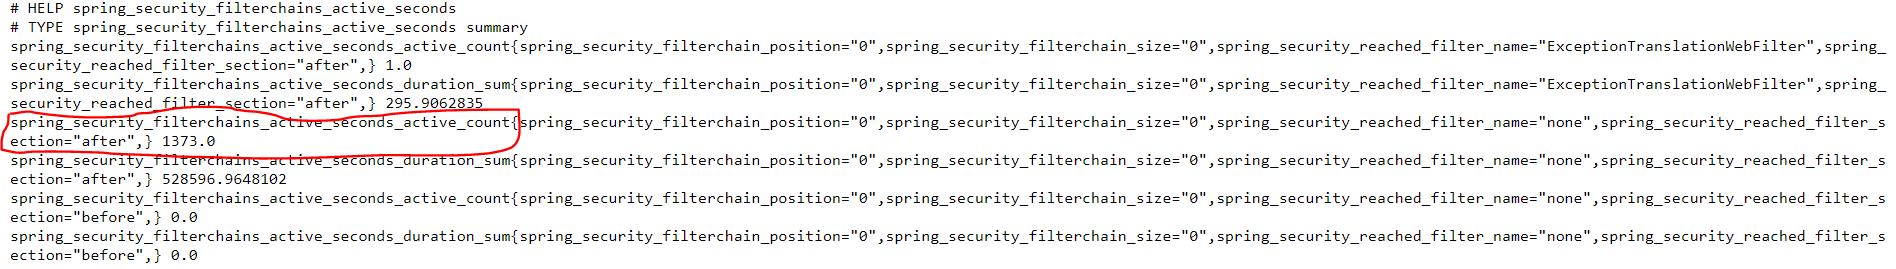
spring.security.filterchains.active with tag spring_security_reached_filter_section="after" has this problem.
In order to reproduce it, it would be better to send some load to the endpoint.
Comment From: FrontierPsychiatrist
In the meantime, since I don't need these values I have added the following configuration to remove the collection of them:
@Configuration
@ConditionalOnBean(WebFilterChainProxy::class)
open class MemoryLeakConfiguration(private val proxy: WebFilterChainProxy) {

  @PostConstruct
  fun patchWebFilterChainProxy() {
    proxy.setFilterChainDecorator(WebFilterChainProxy.DefaultWebFilterChainDecorator())
  }
}
Comment From: pengxo
@FrontierPsychiatrist , You could just disable Spring Security observation then you don't have any metrics like spring.security.*. See the docs here https://docs.spring.io/spring-security/reference/servlet/integrations/observability.html#observability-tracing-disable
Comment From: FrontierPsychiatrist
Ah, thanks. That might be a bit cleaner.
Comment From: jzheaux
Thanks for the report, @pengxo. This may be resolved by #14031. Can you please confirm by trying out the latest snapshot?
Comment From: spring-projects-issues
If you would like us to look at this issue, please provide the requested information. If the information is not provided within the next 7 days this issue will be closed.
Comment From: pengxo
@jzheaux Thanks for the information. I tested with the latest snapshot version 6.2.0-SNAPSHOT locally and it seems to be fixed. After the tests are finished, the active counter is 0.
Also I noticed in the comments that there are other counters that are not accurate such as http.server.requests, which I did not notice before. We are currently using these kind of counter metrics for monitoring. Could you please tell me roughly about when they could be fixed, released and general available?
Comment From: jzheaux
Great, glad to hear that, @pengxo! I'll close this issue as a duplicate of #14031, then. To know GA dates, you can look at the assigned milestone. In this case, this one is assigned to milestone 6.0.9.
As for the inaccurate counts, those are being investigated separately in https://github.com/spring-projects/spring-security/issues/14082.