Description
I've encountered a potential memory leak in the gin-gonic/gin web server. I have tried replicating the issue by creating a simple /health_check endpoint. The endpoint /health_check is hit every second. The issue results in an out-of-memory (OOM) condition when when the available pod memory is exhausted. There is no other container running in the pod.
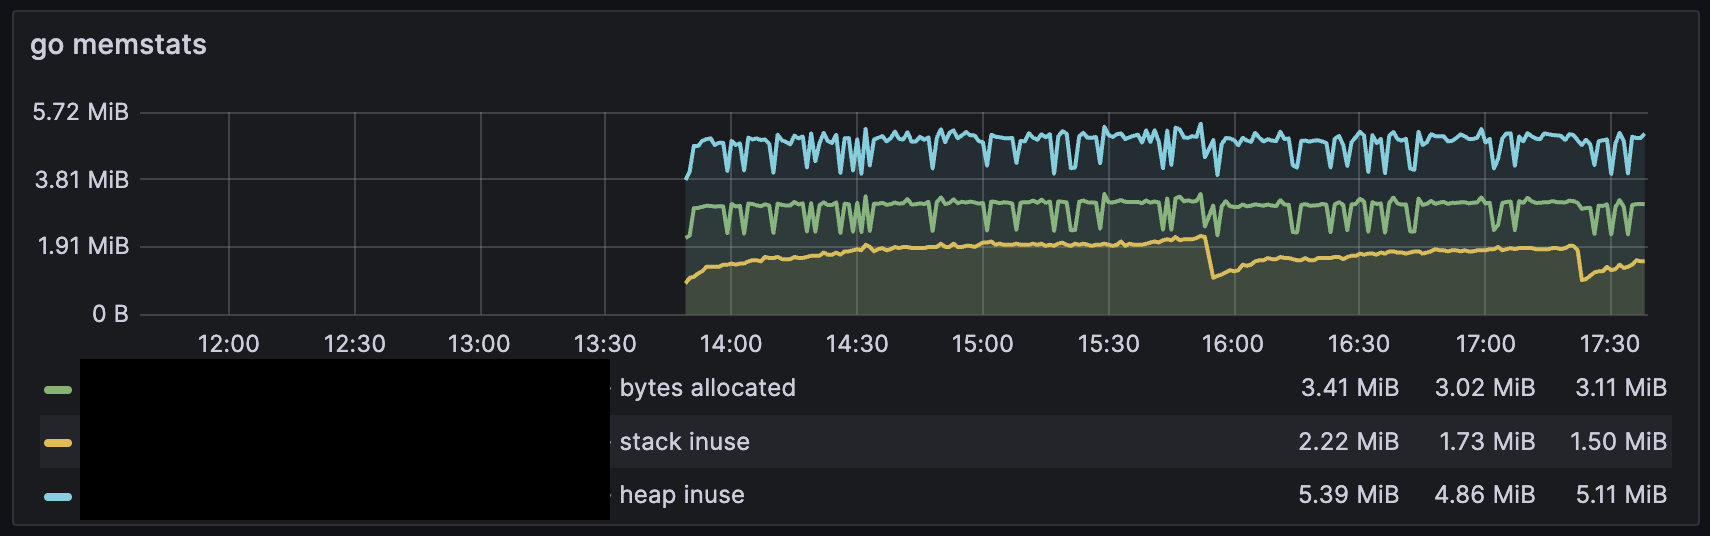
I have also exposed pprof and prometheus metrics to understand the issue, but could not find anything. Don't see any other listed issues reporting the same, so I was hoping someone could help me isolate the issue.
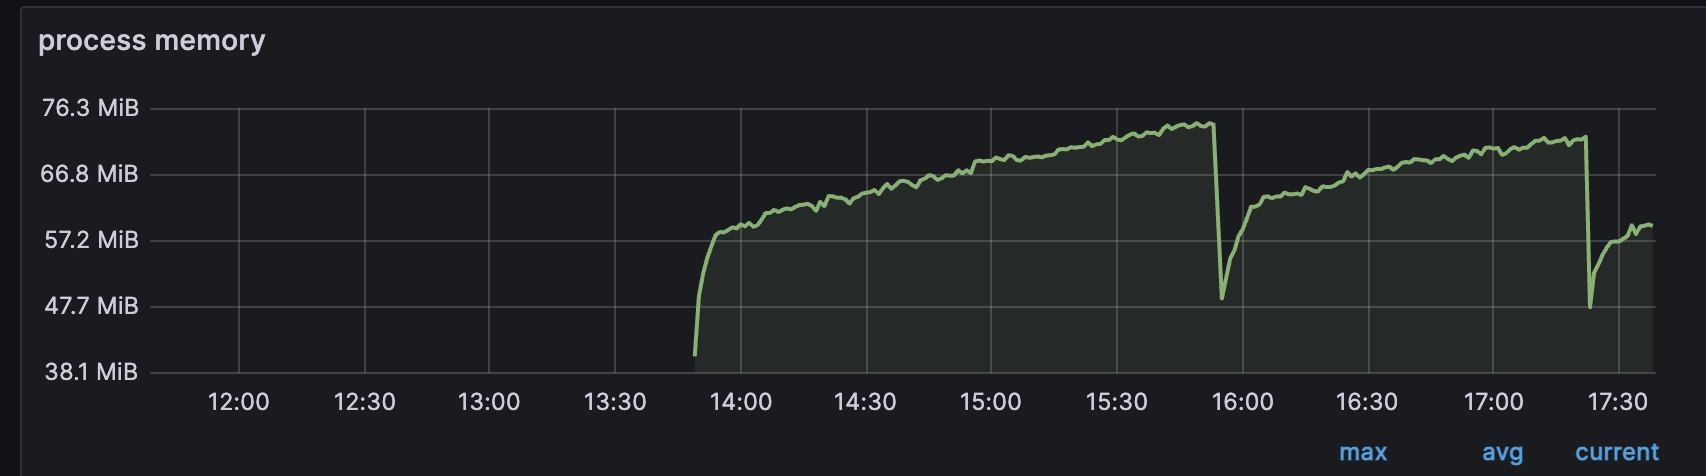
I don't see any increase in heap or stack memory, but the process memory keeps increasing. I can see the increase using RSS and corresponding memory block using pmap, but I am not able to trace why the memory doesn't clear or what that allocated memory is used for.
How to reproduce
Simple code example with relevant endpoints:
package server

import (
    "fmt"
    "net/http"
    _ "net/http/pprof"

    "github.com/gin-gonic/gin"
    "github.com/prometheus/client_golang/prometheus/promhttp"
)

func setupRouter() *gin.Engine {
    router := gin.New()
    router.GET("/health_check", func(c *gin.Context) {
        c.String(http.StatusOK, "Hello World!")
    })
    router.GET("/debug/pprof", gin.WrapF(http.DefaultServeMux.ServeHTTP))
    router.GET("/debug/pprof/:pprofType", gin.WrapF(http.DefaultServeMux.ServeHTTP))
    router.GET("/metrics", func(c *gin.Context) {
        handler := promhttp.Handler()
        handler.ServeHTTP(c.Writer, c.Request)
    })

    return router
}

func Start() {
    router := setupRouter()
    err := router.Run(":8080")
    if err != nil {
        fmt.Printf("Error starting server: %v\n", err)
    }
}
package main

import (
    "example.com/health-check/server"
)

func main() {
    server.Start()
}
Build Command:
go build -ldflags="-s -w" -race -o health-check main.go
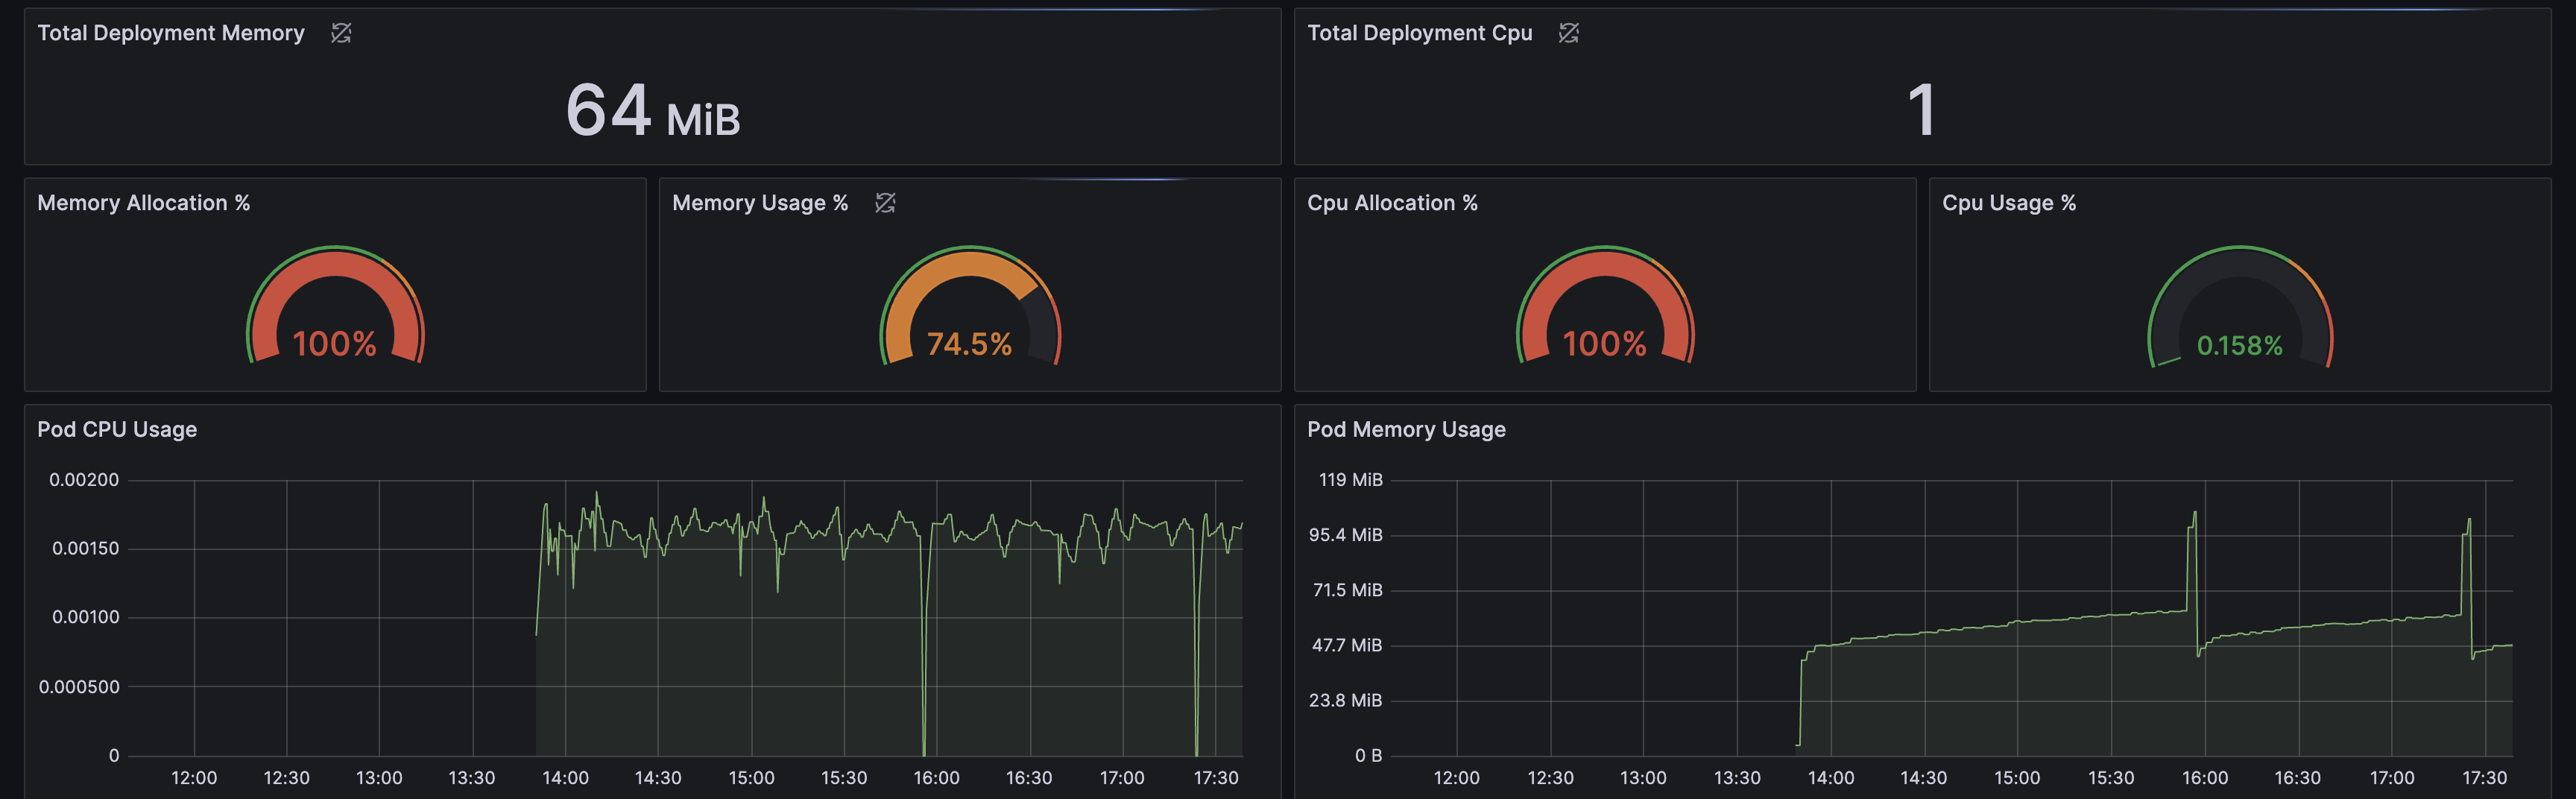
Pod Resource Limits: 1. 64MiB Memory 2. 1 CPU
Expectations
I expected a consistent memory usage. Some fluctuations are fine, but I expect the memory usage to mostly be consistent and not run Out Of Memory.
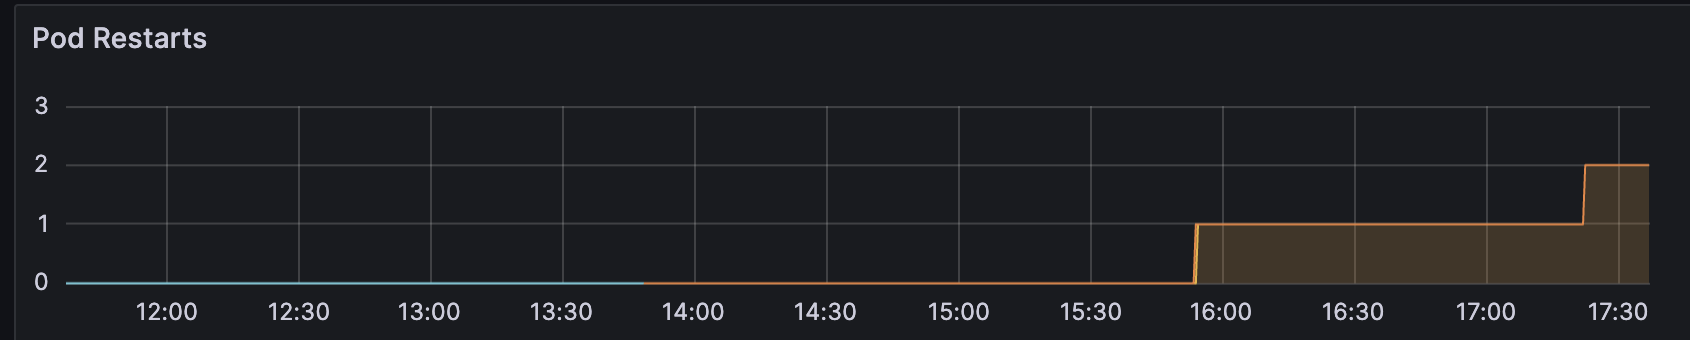
Actual result
The Pod crashed predictably due to continuous memory increase in roughly 90 mins by OOM. Each spike in the below image indicates a pod restart because of OOM.
Goroutines
goroutine 8334 [running]:
runtime/pprof.writeGoroutineStacks({0x7f0e9e220b20, 0xc000506200})
    /usr/local/go/src/runtime/pprof/pprof.go:703 +0x75
runtime/pprof.writeGoroutine({0x7f0e9e220b20, 0xc000506200}, 0x2)
    /usr/local/go/src/runtime/pprof/pprof.go:692 +0x45
runtime/pprof.(*Profile).WriteTo(0x1509f00, {0x7f0e9e220b20, 0xc000506200}, 0xc?)
    /usr/local/go/src/runtime/pprof/pprof.go:329 +0x1b1
net/http/pprof.handler.ServeHTTP({0xc000051601, 0x9}, {0x7f0e5462fd18, 0xc000506200}, 0x0?)
    /usr/local/go/src/net/http/pprof/pprof.go:267 +0x58a
net/http/pprof.Index({0x7f0e5462fd18?, 0xc000506200}, 0xc000506600)
    /usr/local/go/src/net/http/pprof/pprof.go:384 +0x129
net/http.HandlerFunc.ServeHTTP(0xf53ac8, {0x7f0e5462fd18, 0xc000506200}, 0xc0000b0500?)
    /usr/local/go/src/net/http/server.go:2136 +0x48
net/http.(*ServeMux).ServeHTTP(0xc0004a3740?, {0x7f0e5462fd18, 0xc000506200}, 0xc000506600)
    /usr/local/go/src/net/http/server.go:2514 +0xbd
example.com/health-check/server.setupRouter.WrapF.func4(0xc000506200)
    /go/pkg/mod/github.com/gin-gonic/gin@v1.9.1/utils.go:42 +0x97
github.com/gin-gonic/gin.(*Context).Next(...)
    /go/pkg/mod/github.com/gin-gonic/gin@v1.9.1/context.go:174
github.com/gin-gonic/gin.(*Engine).handleHTTPRequest(0xc0001871e0, 0xc000506200)
    /go/pkg/mod/github.com/gin-gonic/gin@v1.9.1/gin.go:620 +0xb91
github.com/gin-gonic/gin.(*Engine).ServeHTTP(0xc0001871e0, {0x105b2e0?, 0xc00027e540}, 0xc000506600)
    /go/pkg/mod/github.com/gin-gonic/gin@v1.9.1/gin.go:576 +0x425
net/http.serverHandler.ServeHTTP({0xc000600db0?}, {0x105b2e0, 0xc00027e540}, 0xc000506600)
    /usr/local/go/src/net/http/server.go:2938 +0x2a2
net/http.(*conn).serve(0xc000240900, {0x105c478, 0xc0001ad5c0})
    /usr/local/go/src/net/http/server.go:2009 +0xc25
created by net/http.(*Server).Serve in goroutine 1
    /usr/local/go/src/net/http/server.go:3086 +0x80d

goroutine 1 [IO wait]:
internal/poll.runtime_pollWait(0x7f0e9ea9d410, 0x72)
    /usr/local/go/src/runtime/netpoll.go:343 +0x85
internal/poll.(*pollDesc).wait(0xc0003a62a0, 0x4ae001?, 0x0)
    /usr/local/go/src/internal/poll/fd_poll_runtime.go:84 +0xb1
internal/poll.(*pollDesc).waitRead(...)
    /usr/local/go/src/internal/poll/fd_poll_runtime.go:89
internal/poll.(*FD).Accept(0xc0003a6280)
    /usr/local/go/src/internal/poll/fd_unix.go:611 +0x405
net.(*netFD).accept(0xc0003a6280)
    /usr/local/go/src/net/fd_unix.go:172 +0x3e
net.(*TCPListener).accept(0xc00024d480)
    /usr/local/go/src/net/tcpsock_posix.go:152 +0x3e
net.(*TCPListener).Accept(0xc00024d480)
    /usr/local/go/src/net/tcpsock.go:315 +0x65
net/http.(*Server).Serve(0xc00054c000, {0x105b520, 0xc00024d480})
    /usr/local/go/src/net/http/server.go:3056 +0x57f
net/http.(*Server).ListenAndServe(0xc00054c000)
    /usr/local/go/src/net/http/server.go:2985 +0xbd
net/http.ListenAndServe(...)
    /usr/local/go/src/net/http/server.go:3239
github.com/gin-gonic/gin.(*Engine).Run(0xc0001871e0, {0xc0003bbef8, 0x1, 0x1})
    /go/pkg/mod/github.com/gin-gonic/gin@v1.9.1/gin.go:386 +0x38d
example.com/health-check/server.Start()
    /app/server/server.go:49 +0x52
main.main()
    /app/main.go:8 +0x1d

goroutine 82 [IO wait]:
internal/poll.runtime_pollWait(0x7f0e9ea9d318, 0x72)
    /usr/local/go/src/runtime/netpoll.go:343 +0x85
internal/poll.(*pollDesc).wait(0xc0002c60a0, 0xc000568000?, 0x0)
    /usr/local/go/src/internal/poll/fd_poll_runtime.go:84 +0xb1
internal/poll.(*pollDesc).waitRead(...)
    /usr/local/go/src/internal/poll/fd_poll_runtime.go:89
internal/poll.(*FD).Read(0xc0002c6080, {0xc000568000, 0x1000, 0x1000})
    /usr/local/go/src/internal/poll/fd_unix.go:164 +0x3e5
net.(*netFD).Read(0xc0002c6080, {0xc000568000, 0x1000, 0x1000})
    /usr/local/go/src/net/fd_posix.go:55 +0x4b
net.(*conn).Read(0xc000514010, {0xc000568000, 0x1000, 0x1000})
    /usr/local/go/src/net/net.go:179 +0xad
net/http.(*connReader).Read(0xc0002c4450, {0xc000568000, 0x1000, 0x1000})
    /usr/local/go/src/net/http/server.go:791 +0x2b5
bufio.(*Reader).fill(0xc000536d20)
    /usr/local/go/src/bufio/bufio.go:113 +0x29a
bufio.(*Reader).Peek(0xc000536d20, 0x4)
    /usr/local/go/src/bufio/bufio.go:151 +0xc7
net/http.(*conn).serve(0xc0002e21b0, {0x105c478, 0xc0001ad5c0})
    /usr/local/go/src/net/http/server.go:2044 +0xe7c
created by net/http.(*Server).Serve in goroutine 1
    /usr/local/go/src/net/http/server.go:3086 +0x80d

goroutine 8335 [IO wait]:
internal/poll.runtime_pollWait(0x7f0e9ea9d128, 0x72)
    /usr/local/go/src/runtime/netpoll.go:343 +0x85
internal/poll.(*pollDesc).wait(0xc0002c62a0, 0xc000600dc1?, 0x0)
    /usr/local/go/src/internal/poll/fd_poll_runtime.go:84 +0xb1
internal/poll.(*pollDesc).waitRead(...)
    /usr/local/go/src/internal/poll/fd_poll_runtime.go:89
internal/poll.(*FD).Read(0xc0002c6280, {0xc000600dc1, 0x1, 0x1})
    /usr/local/go/src/internal/poll/fd_unix.go:164 +0x3e5
net.(*netFD).Read(0xc0002c6280, {0xc000600dc1, 0x1, 0x1})
    /usr/local/go/src/net/fd_posix.go:55 +0x4b
net.(*conn).Read(0xc0000b04d0, {0xc000600dc1, 0x1, 0x1})
    /usr/local/go/src/net/net.go:179 +0xad
net/http.(*connReader).backgroundRead(0xc000600db0)
    /usr/local/go/src/net/http/server.go:683 +0x83
created by net/http.(*connReader).startBackgroundRead in goroutine 8334
    /usr/local/go/src/net/http/server.go:679 +0x246
Environment
- go version: go1.21.1 linux/amd64
- docker image: 1.21.1-bullseye
- gin version (or commit ref): github.com/gin-gonic/gin v1.9.1
- operating system: Debian GNU/Linux 11 (bullseye)
- GOGC=10;GOMEMLIMIT=64MiB (tried with default values as well, but same result)
Any help is appreciated, thanks a lot.
Comment From: kokizzu
same thing happened to me, but from pprof/heap profile it was tls.HandshakeContext that have the most memory usage
Comment From: rohitChaku
@kokizzu were you able to identify the issue in your case?
Comment From: kokizzu
for me after changing
byt, _ := io.ReadAll(ctx.Request.Body)
_ = json.Unmarshall(byt, &in)
to
_ = ctx.ShouldBindJSON(&in)
it no longer leaks (or maybe still leaking? just the rps now 90% lower than previous days)
Comment From: rohitChaku
@kokizzu Thanks for the info, in my case, after some experiments I found it to be a build issue. The -race flag in build seemed to have been causing the ever increasing memory.
I removed the flag and ran a couple of tests, seems to be fine for now. I am closing the issue for now, but may reopen in case the issue happens again, thanks. StackOverflow answer reference: 15776437
Comment From: rohitChaku
https://go.dev/doc/articles/race_detector