Based on the Stack Overflow question here I believe I've found a bug for when a scatter plot only has three points. The full details are in the question but I'll sketch out the details here.
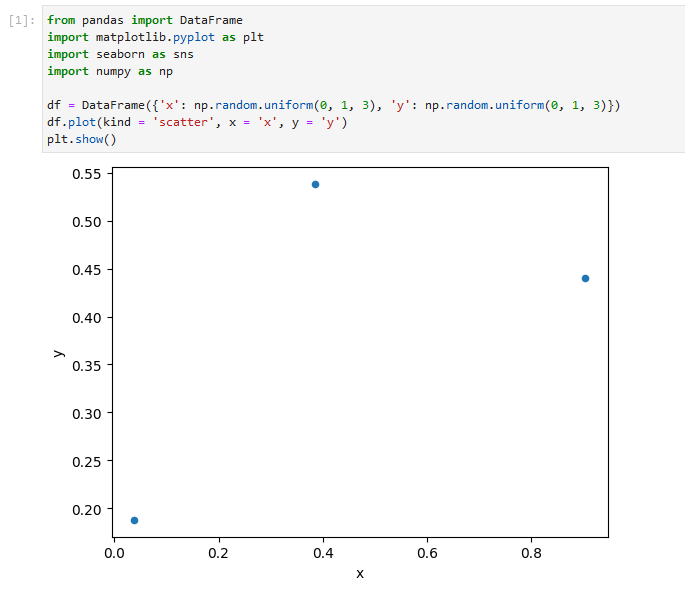
The code (below) will create a scatter plot where each of the points has a different colour, rather than a single consistent colour (as is expected).
It happens particularly when seaborn is used because, by default, seaborn will modify the rcParams['patch.facecolor'] to be an RGB tuple. If you don't use seaborn then this value defaults to a string 'b' which indicates the colour blue. Of course, this bug would arise whenever a user may use a custom patch.facecolor that happens to be an RGB tuple, so it isn't specifically restricted to seaborn.
The issue arises because when a sequence of numbers is passed for the c argument with matplotlib, matplotlib will try to map it to the current colormap. When there are only three scatter points the sequence lengths match (i.e. len(data) == len(colors)) and so the numbers are mapped and the resulting colours used in the plot.
Reproducing code
from pandas import DataFrame
import matplotlib.pyplot as plt
import seaborn as sns
import numpy as np

df = DataFrame({'x': np.random.uniform(0, 1, 3), 'y': np.random.uniform(0, 1, 3)})
df.plot(kind = 'scatter', x = 'x', y = 'y')
plt.show()
Versions
INSTALLED VERSIONS
------------------
commit: None
python: 3.4.2.final.0
python-bits: 64
OS: Windows
OS-release: 7
machine: AMD64
processor: Intel64 Family 6 Model 42 Stepping 7, GenuineIntel
byteorder: little
LC_ALL: None
LANG: None

pandas: 0.15.0
nose: 1.3.3
Cython: None
numpy: 1.9.0
scipy: 0.14.0
statsmodels: 0.5.0
IPython: 2.4.1
sphinx: 1.2.2
patsy: 0.3.0
dateutil: 2.2
pytz: 2014.7
bottleneck: None
tables: None
numexpr: None
matplotlib: 1.4.2
openpyxl: 2.0.5
xlrd: None
xlwt: None
xlsxwriter: None
lxml: None
bs4: 4.3.2
html5lib: None
httplib2: None
apiclient: None
rpy2: None
sqlalchemy: None
pymysql: None
psycopg2: None
Comment From: TomAugspurger
Thanks for the report. Do you know where matplotlib gets the default for their facecolors for plt.plot(df.x, df.y)?
I'm not too sure what the solution here is. We could add a check to see if the len(df) is 3 and warn.
Comment From: Ffisegydd
For plt.scatter c defaults to 'b' as per the code here.
Note that I think it's also possible to have RGBA tuples, I'll see if I can test whether having an RGBA tuple causes 4 points to do the same thing. So I suppose it'd have to be len(df) <= 4 or some such?
EDIT:
Yes if you had an RGBA tuple then having four points would cause the same issue. For example:
from pandas import DataFrame #0.16.0
import matplotlib.pyplot as plt #1.4.3
#import seaborn as sns #0.5.1
import numpy as np #1.9.2

plt.rcParams['patch.facecolor'] = (0.0, 0.33, 0.66, 1.0)

df = DataFrame({'x': np.random.uniform(0, 1, 4), 'y': np.random.uniform(0, 1, 4)})
#df = DataFrame({'x': np.random.uniform(0, 1, 3), 'y': np.random.uniform(0, 1, 3)})
df.plot(kind = 'scatter', x = 'x', y = 'y')
plt.show()
Comment From: MarcoGorelli
looks fine now?
let's close, doing a git bisect on 0.15.0 doesn't seem worthwhile