Code Sample, a copy-pastable example if possible
import pandas as pd
import matplotlib.pyplot as plt
df = pd.DataFrame()
df['x'] = range(0,100,5)
df['y'] = range(0,1000,50)
df = df.set_index('x')
# line plot
df.plot.line()
plt.savefig('line')
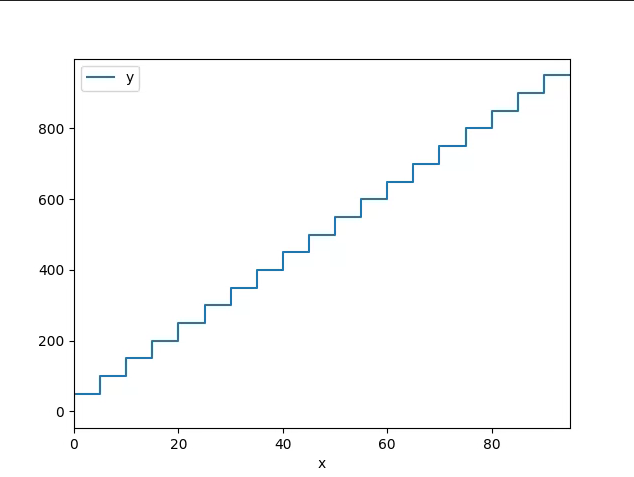
# stepped line plot
df.plot.line(drawstyle="steps")
plt.savefig('line-steps')
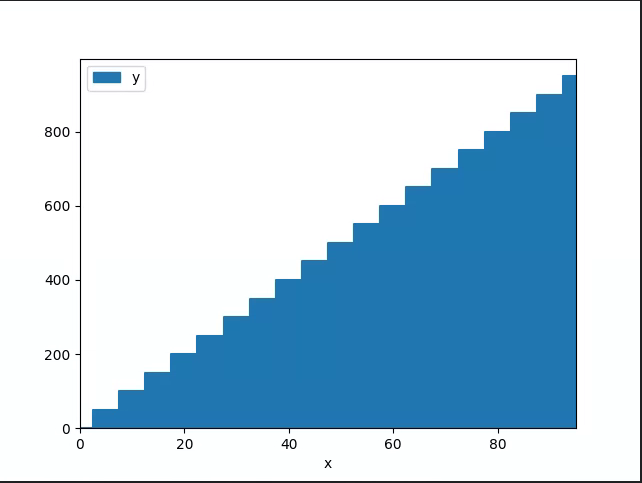
# area plot
df.plot.area()
plt.savefig('area')
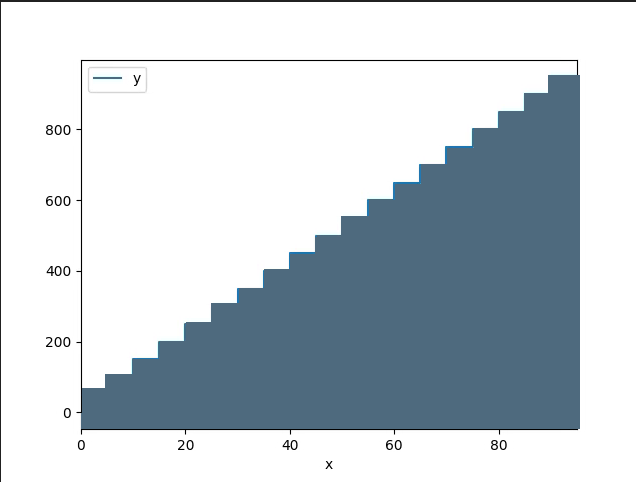
# Feature Request: stepped area plot
df.plot.area(drawstyle="steps-mid")
plt.savefig('area-steps')
# Alternative solution, use bar plots.
df.plot.bar(width=1.0)
plt.savefig('bar')
Problem description
It would be nice to be able to create a "stepped" area plot. Similar to a line(drawstyle="steps"), but with the area under the line filled in:
df.plot.line(drawstyle="steps")
As a work around, I have been plotting a bar plot with width=1.0:
df.plot.bar(width=1.0)
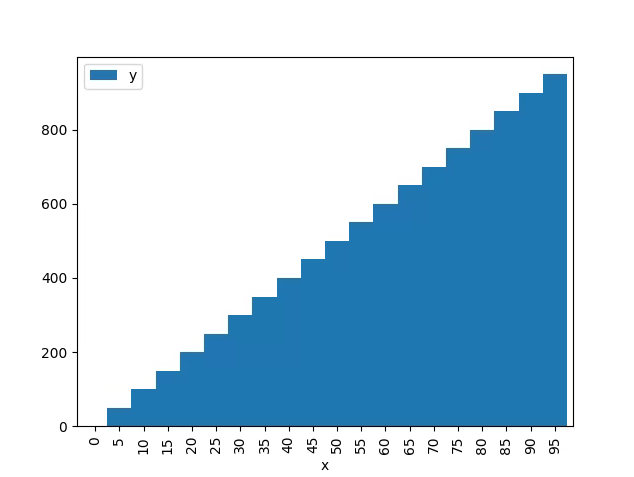
however this has issues of its own:
- It is much slower with lots of data
- Will have to limit the xaxis labels, by default it will generate a label per bar.
- It doesn't interact well with line plots on a secondary y-axis
Alternatively, I think could manually resample the data, but it would be really nice to have similar drawstyle='steps'
Expected Output
I would expect a plot similar to this:
df.plot.area(drawstyle="steps")
Comment From: nick-schultz
I think I figured out what needs to be done.
I noticed that matplotlib has different ways of drawing a step function
for plotting lines, it uses drawstyle, for the filling( fill_between) , it uses step.
so I passed both of those arguments separately and I noticed two different exceptions:
df.plot.area(drawstyle="steps-mid")
Traceback (most recent call last):
  File "run.py", line 18, in <module>
    df.plot.area(drawstyle="steps-mid")
  File "/local_vol1_nobackup/tmp/venv/lib/python3.7/site-packages/pandas/plotting/_core.py", line 1308, in area
    return self(kind="area", x=x, y=y, **kwargs)
  File "/local_vol1_nobackup/tmp/venv/lib/python3.7/site-packages/pandas/plotting/_core.py", line 794, in __call__
    return plot_backend.plot(data, kind=kind, **kwargs)
  File "/local_vol1_nobackup/tmp/venv/lib/python3.7/site-packages/pandas/plotting/_matplotlib/__init__.py", line 62, in plot
    plot_obj.generate()
  File "/local_vol1_nobackup/tmp/venv/lib/python3.7/site-packages/pandas/plotting/_matplotlib/core.py", line 281, in generate
    self._make_plot()
  File "/local_vol1_nobackup/tmp/venv/lib/python3.7/site-packages/pandas/plotting/_matplotlib/core.py", line 1079, in _make_plot
    **kwds
  File "/local_vol1_nobackup/tmp/venv/lib/python3.7/site-packages/pandas/plotting/_matplotlib/core.py", line 1259, in _plot
    rect = ax.fill_between(xdata, start, y_values, **kwds)
  File "/local_vol1_nobackup/tmp/venv/lib/python3.7/site-packages/matplotlib/__init__.py", line 1601, in inner
    return func(ax, *map(sanitize_sequence, args), **kwargs)
  File "/local_vol1_nobackup/tmp/venv/lib/python3.7/site-packages/matplotlib/axes/_axes.py", line 5295, in fill_between
    collection = mcoll.PolyCollection(polys, **kwargs)
  File "/local_vol1_nobackup/tmp/venv/lib/python3.7/site-packages/matplotlib/collections.py", line 1044, in __init__
    Collection.__init__(self, **kwargs)
  File "/local_vol1_nobackup/tmp/venv/lib/python3.7/site-packages/matplotlib/collections.py", line 162, in __init__
    self.update(kwargs)
  File "/local_vol1_nobackup/tmp/venv/lib/python3.7/site-packages/matplotlib/artist.py", line 974, in update
    ret = [_update_property(self, k, v) for k, v in props.items()]
  File "/local_vol1_nobackup/tmp/venv/lib/python3.7/site-packages/matplotlib/artist.py", line 974, in <listcomp>
    ret = [_update_property(self, k, v) for k, v in props.items()]
  File "/local_vol1_nobackup/tmp/venv/lib/python3.7/site-packages/matplotlib/artist.py", line 970, in _update_property
    .format(type(self).__name__, k))
AttributeError: 'PolyCollection' object has no property 'drawstyle'
df.plot.area(step="mid")
Traceback (most recent call last):
  File "run.py", line 18, in <module>
    df.plot.area(step="mid")
  File "/local_vol1_nobackup/tmp/venv/lib/python3.7/site-packages/pandas/plotting/_core.py", line 1308, in area
    return self(kind="area", x=x, y=y, **kwargs)
  File "/local_vol1_nobackup/tmp/venv/lib/python3.7/site-packages/pandas/plotting/_core.py", line 794, in __call__
    return plot_backend.plot(data, kind=kind, **kwargs)
  File "/local_vol1_nobackup/tmp/venv/lib/python3.7/site-packages/pandas/plotting/_matplotlib/__init__.py", line 62, in plot
    plot_obj.generate()
  File "/local_vol1_nobackup/tmp/venv/lib/python3.7/site-packages/pandas/plotting/_matplotlib/core.py", line 281, in generate
    self._make_plot()
  File "/local_vol1_nobackup/tmp/venv/lib/python3.7/site-packages/pandas/plotting/_matplotlib/core.py", line 1079, in _make_plot
    **kwds
  File "/local_vol1_nobackup/tmp/venv/lib/python3.7/site-packages/pandas/plotting/_matplotlib/core.py", line 1240, in _plot
    lines = MPLPlot._plot(ax, x, y_values, style=style, **line_kwds)
  File "/local_vol1_nobackup/tmp/venv/lib/python3.7/site-packages/pandas/plotting/_matplotlib/core.py", line 652, in _plot
    return ax.plot(*args, **kwds)
  File "/local_vol1_nobackup/tmp/venv/lib/python3.7/site-packages/matplotlib/axes/_axes.py", line 1666, in plot
    lines = [*self._get_lines(*args, data=data, **kwargs)]
  File "/local_vol1_nobackup/tmp/venv/lib/python3.7/site-packages/matplotlib/axes/_base.py", line 225, in __call__
    yield from self._plot_args(this, kwargs)
  File "/local_vol1_nobackup/tmp/venv/lib/python3.7/site-packages/matplotlib/axes/_base.py", line 405, in _plot_args
    seg = func(x[:, j % ncx], y[:, j % ncy], kw, kwargs)
  File "/local_vol1_nobackup/tmp/venv/lib/python3.7/site-packages/matplotlib/axes/_base.py", line 312, in _makeline
    seg = mlines.Line2D(x, y, **kw)
  File "/local_vol1_nobackup/tmp/venv/lib/python3.7/site-packages/matplotlib/lines.py", line 404, in __init__
    self.update(kwargs)
  File "/local_vol1_nobackup/tmp/venv/lib/python3.7/site-packages/matplotlib/artist.py", line 974, in update
    ret = [_update_property(self, k, v) for k, v in props.items()]
  File "/local_vol1_nobackup/tmp/venv/lib/python3.7/site-packages/matplotlib/artist.py", line 974, in <listcomp>
    ret = [_update_property(self, k, v) for k, v in props.items()]
  File "/local_vol1_nobackup/tmp/venv/lib/python3.7/site-packages/matplotlib/artist.py", line 970, in _update_property
    .format(type(self).__name__, k))
AttributeError: 'Line2D' object has no property 'step'
so in pandas/plotting/_matplotlib/core.py:1260: AreaPlot._plot() first calls the lines, which accepts drawstyle, and then fills in the area using ax.fill_between which uses step parameter.
so, just before the call to fill_between I inserted this piece of code:
        if "drawstyle" in kwds:
            kwds.pop("drawstyle")
            kwds["step"] = "mid"
now, I get the following behavior: df.plot.area(drawstyle="steps-mid")
I think this is exactly what I want. What is the appropriate way to implement this?
There are different options for steps: {pre, post, and mid}
and equivalent options for drawstyle: {default, steps, steps-pre, steps-mid, steps-post}
My example code is hardcoded, but the final solution should support all options.
Comment From: nick-schultz
As a short-term workaround in my local project, monkey patching MPLPlot._plot to perform the conversion gives me the desired behavior:
import pandas
from pandas.plotting._matplotlib.core import MPLPlot

class PatchedMPLPlot(MPLPlot):
    def _plot(*args,**kwds):
        if "step" in kwds:
            kwds["drawstyle"] = "steps-" + kwds["step"]
            kwds.pop("step")
        return MPLPlot._plot(*args, **kwds)

pandas.plotting._matplotlib.core.MPLPlot = PatchedMPLPlot
and use the plot.area() like so:
df.plot.area(step="pre")
plt.savefig('area-steps-pre')

df.plot.area(step="post")
plt.savefig('area-steps-post')

df.plot.area(step="mid")
plt.savefig('area-steps-mid')
Comment From: enritoomeyspire
Is this issue solved? I just stumble with same issue with pd.version='1.3.4', release in October 2021.
Comment From: mperzichilli
Also looking for exactly this behavior