I'm not sure the problem is spring boot, but I'm having problems finding it. The Jar is currently taking 3 seconds (9 if I live out tiered) to run on my system. Just to error out due to missing options and do nothing.
https://github.com/xenoterracide/brix/tree/8e3d86bcf773e564cc24b51572b0bbd8bb60b73f
time java -Xverify:none -XX:TieredStopAtLevel=1 -jar modules/app/build/libs/app-0.1.0.jar                                                  # brix -> ccushing/copy-5-1
Missing required parameters: '<language>', '<moduleType>', '<project>'
Usage: <main class> [--repo=<repo>] [--workdir=<workdir>] <language>
                    <moduleType> <project>  [COMMAND]
      <language>            The programming language you're generating code
                              for. Directory under --dir
      <moduleType>          The type of code you're generating e.g controller,
                              also the name of the config file without the
                              extension.
      <project>             The name of the project you're generating code for.
                            The name of the module to be created within the
                              project.
      --repo=<repo>         Repository path from the current working directory.
                              Templates and configs are looked up relative to
                              here. If the config isn't found here, then we
                              will search ~/.config/brix
      --workdir=<workdir>   The working directory you want your destination
                              paths to be relative to. Defaults to current
                              working directory
                              Default:
Commands:
  run
java -Xverify:none -XX:TieredStopAtLevel=1 -jar   3.15s user 0.26s system 142% cpu 2.386 total
since it's a CLI app lazy init isn't helpful. This is worded like a question (that really would not be suitable for stackoverflow, I hate that SO is the support forum for things now, it's terrible because of the attitude of people that the objective is not to help people, also it's bad at getting answers for harder problems, spring should get a discourse or something again), but I also know I had a tika CLI app in the past that loaded in less than 1s without Tiered, so I'm also concerned it's a spring boot bug. I'm going to connect a profiler later to see what I can find, but I'm not sure that will do it.
Fedora 33
5.11.16-200.fc33.x86_64
 14:08:34 up 3 days,  2:04,  1 user,  load average: 0.79, 1.10, 1.66
              total        used        free      shared  buff/cache   available
Mem:            15G         11G        1.0G        1.4G        3.0G        2.3G
Swap:           12G        1.5G         10G
 ./gradlew :app:dependencyInsight --configuration runtimeClasspath --dependency spring-boot-starter-parent                                  # brix -> ccushing/copy-5-1
Type-safe dependency accessors is an incubating feature.
Type-safe project accessors is an incubating feature.

> Task :app:dependencyInsight
org.springframework.boot:spring-boot-starter-parent:2.5.0
   variant "platform-runtime" [
      org.gradle.status              = release (not requested)
      org.gradle.usage               = java-runtime
      org.gradle.category            = platform (compatible with: library)

      Requested attributes not found in the selected variant:
         org.gradle.libraryelements     = jar
         org.gradle.dependency.bundling = external
         org.gradle.jvm.environment     = standard-jvm
         org.gradle.jvm.version         = 11
   ]
   Selection reasons:
      - By constraint : dependency was locked to version '2.5.0'
      - By ancestor

org.springframework.boot:spring-boot-starter-parent:{strictly 2.5.0} -> 2.5.0
\--- runtimeClasspath

org.springframework.boot:spring-boot-starter-parent:2.+ -> 2.5.0
+--- runtimeClasspath
+--- project :cli:api
|    +--- project :cli:config
|    |    \--- runtimeClasspath
|    +--- project :config-loader:yaml
|    |    \--- runtimeClasspath
|    +--- project :processor:pebble
|    |    \--- runtimeClasspath
|    +--- project :dispatch
|    |    \--- project :cli:config (*)
|    +--- project :config-loader:service
|    |    \--- project :dispatch (*)
|    \--- project :config-loader:api
|         +--- project :config-loader:yaml (*)
|         +--- project :processor:pebble (*)
|         +--- project :processor:api
|         |    +--- project :processor:pebble (*)
|         |    \--- project :dispatch (*)
|         \--- project :config-loader:service (*)
+--- project :cli:config (*)
+--- project :config-loader:api (*)
+--- project :config-loader:service (*)
+--- project :config-loader:yaml (*)
+--- project :dispatch (*)
+--- project :processor:api (*)
+--- project :processor:pebble (*)
+--- project :util:file
|    +--- project :processor:pebble (*)
|    \--- project :config-loader:service (*)
\--- project :util:lang
     +--- project :processor:pebble (*)
     \--- project :config-loader:service (*)

(*) - dependencies omitted (listed previously)

A web-based, searchable dependency report is available by adding the --scan option.

BUILD SUCCESSFUL in 1s
1 actionable task: 1 executed
 ./gradlew --version                                                                                                                        # brix -> ccushing/copy-5-1

------------------------------------------------------------
Gradle 7.0.2
------------------------------------------------------------

Build time:   2021-05-14 12:02:31 UTC
Revision:     1ef1b260d39daacbf9357f9d8594a8a743e2152e

Kotlin:       1.4.31
Groovy:       3.0.7
Ant:          Apache Ant(TM) version 1.10.9 compiled on September 27 2020
JVM:          11.0.10 (AdoptOpenJDK 11.0.10+9)
OS:           Linux 5.11.16-200.fc33.x86_64 amd64
Comment From: bclozel
You could try Java Flight Recorder (using Spring Framework additional tracking support) to run your CLI app.
This should give you plenty of information of where time is being spent.
Comment From: xenoterracide
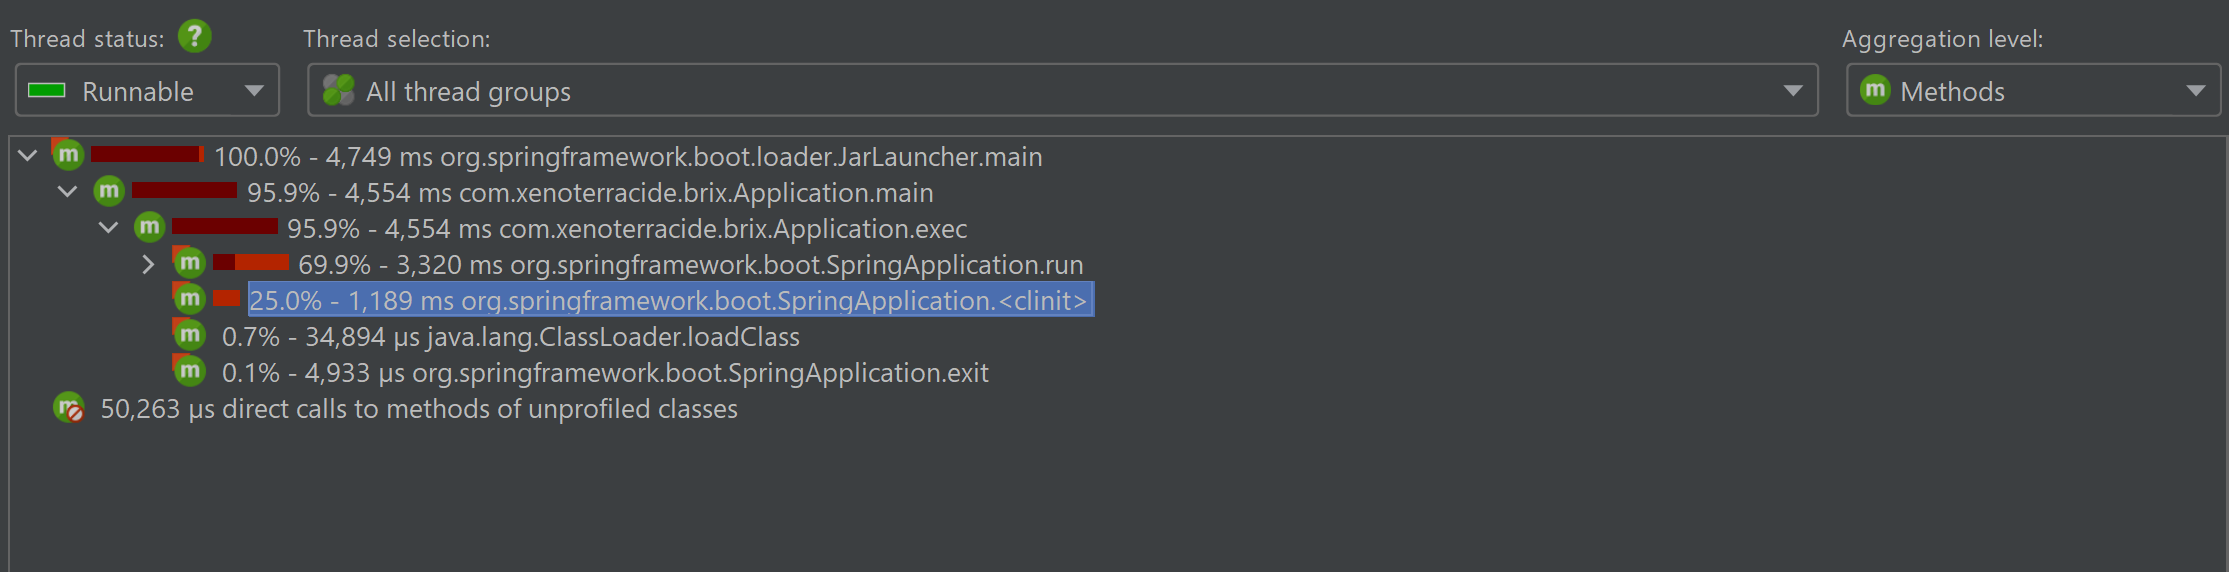
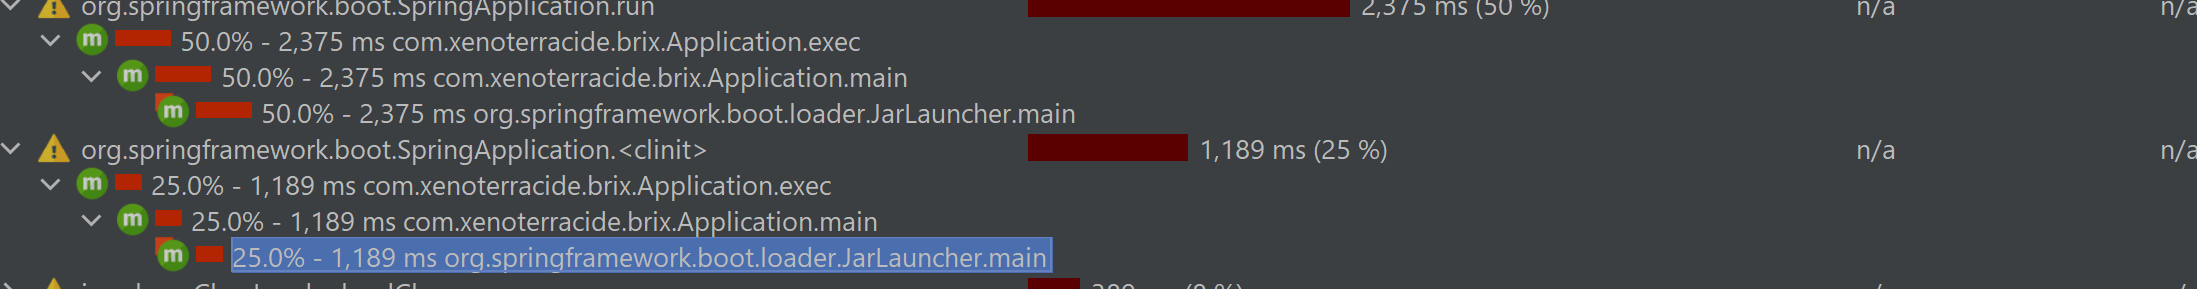
hadn't gotten around to profiling yet, but am now, according to jprofiler 25% (over 1s) is being spent in SpringApplication.<clinit>
brix-snapshot.zip
Comment From: bclozel
I don't think we've changed things in SpringApplication recently. <clinit> is really strange.
It's not really clear what you're comparing here; the issue you linked seems to indicate that this is a OS-specific problem. Does the same happen when you downgrade Spring Boot to 2.4.x? Does your profiling tool shows more about the actual timeline (especially class loading and I/O)?
Comment From: xenoterracide
I don't think we've changed things in SpringApplication recently.
is really strange.
the application I wrote before was a while ago, if I had to guess 4 years ;) so it was probably Spring Boot 1, and it was super tiny.
It's not really clear what you're comparing here; the issue you linked seems to indicate that this is a OS-specific problem
This is looking at CPU. You can get JProfiler to show just about anything. I attached the snapshot that I took with JProfiler if you want to look at it.
There shouldn't really be much in the way of IO,as this is doing nothing except loading the spring context and parsing the CLI args. Given this is showing JarLauncher, inferring from the name, I wonder if it's loading jar's inside the fatpacked jar, I don't know how that actually works. I am seeing if I can flatten my multi-project jars into classes inside of the fatpacked jar, no luck yet though. I've managed to filter the jar's but not add the classes.
There may be an OS specific component too... I'm going to ignore that since java on windows gives me about the same amount of time as fedora with tiered, 2-4 seconds is still too high for a cli app to just exit, IMO.
You can get it to show more, this is looking at CPU, but that could include wait time.
Comment From: xenoterracide
Java Flight Recorder
public static void main( String... args ) {
System.exit( exec( args ) );
}
static int exec( String... args ) {
var sa = SpringApplication.run( Application.class, args );
sa.setApplicationStartup( new FlightRecorderApplicationStartup() );
return SpringApplication.exit( sa );
}
```
I suspect that's the change to my code I need to do, the docs aren't very clear in that regard... however from what I've read I'd need to collect the data with `jcmd`, which has to be run by hand connecting to the process. I know I'm saying it's slow but any suggestions on how to do that fast enough to actually capture data?
**Comment From: xenoterracide**
Files


Classloaders


**Comment From: bclozel**
Your code snippet won't set the application startup implementation since it's creating a new SpringApplication right after. Spring Boot [documents the same for the buffering implementation](https://docs.spring.io/spring-boot/docs/current/reference/html/features.html#features.spring-application.startup-tracking).
In your case, something like:
```java
public static void main( String... args ) {
// let Spring instantiate and inject dependencies
System.exit( exec( args ) );
}
static int exec( String... args ) {
SpringApplication springApplication = new SpringApplication( Application.class );
springApplication.setApplicationStartup( new FlightRecorderApplicationStartup() );
return SpringApplication.exit( springApplication.run( args ) );
}
And then running your CLI app with:
java -XX:StartFlightRecording:filename=recording.jfr,duration=5s -jar modules/app/build/libs/app-0.1.0.jar
I ran your application with both JFR and Yourkit profiler and didn't find a particular culprit here. The context refresh is quite fast, with the dominator beans being the scopedTarget.cliCommand, the dispatcher and various infrastructure bits like the pebble template processor, the tika configuration (eagerly loading a 7K lines XML file), the custom Yaml infrastructure...
The rest seems to be mostly about class loading and the CPU doesn't seem to be maxed out.
I'm closing this issue now since I haven't found a particular problem with Spring Boot infrastructure.
Comment From: xenoterracide
the yaml and tika should not be loaded at this time, in ccushing/performance-9, I optimized that with proxies and lazy loading. I will make a complaint to tika though.
re-pico CLI, it looks like it's the loading of Jansi, and we're discussing whether or not there's a better way to detect its requirement than Class.forName if you've any advice there, could you drop it on the ticket.
One theory I had is that this may be improved with using Jigsaw, so that classpath scanning is reduced, however, I'm not excessively fluent in that yet (and there's actually problems implementing that, that I'm reporting), however, it looked like spring is using automatic module naming and not providing an actual module-info? could this improve class loading?
would unpack-ing all of my jars help with the class loading issues? I tried to modify my :app build script to do this, but I've had no luck. Here's what I tried, but It turned out that parent.subprojects do not have their plugins loaded, a println (different from that) showed an empty array.
tasks.withType<BootJar> {
  mainClass.set("com.xenoterracide.brix.Application")
  // add all classes from brix
  parent?.subprojects?.filterNot { p -> p == project }?.forEach { p ->
    println(p)
    if (p.plugins.hasPlugin("java-platform")) {
      from(p.sourceSets["main"].output.classesDirs) {
        into("BOOT-INFO/classes")
      }
    }
  }
  // filter jars from brix
  exclude { ft ->
    parent
      ?.subprojects
      ?.flatMap { p -> p.tasks }
      ?.filterIsInstance<Jar>()
      ?.any { j -> j.archiveFileName.get() == ft.name }
      ?: false
  }
also per yaml, I had considered using spring boot simply to load those configurations but to be honest I'm uncertain how to ask spring boot to load a configuration from a path I specify (or an ish, like look at this directory file a file with basename), perhaps you could tell me how to do that?
~~as per CLI app with flight recorder isn't that the exact same as the snippet I wrote? but yes I didn't include it in the code, just here as that's what I had tried.~~ oh, I see it now, I wasn't sure that would work with Spring Boot... At the very worst could this, or another ticket is used to improve that documentation, either there, or in the spring boot documentation itself.