Not sure if that's a pandas or a mathplotlib bug.
import pandas
df = pandas.DataFrame({"year":[1,2,3,4],"name": [u"abc", u"bcd", u"cde", u"abc"]})
df["year"].hist() # Works
df["name"].hist()
TypeError                                 Traceback (most recent call last)
<ipython-input-11-79a5ab7bbbd5> in <module>()
----> 1 df["name"].hist()

C:\portabel\Python27\lib\site-packages\pandas\tools\plotting.pyc in hist_series(self, by, ax, grid, xlabelsize, xrot, ylabelsize, yrot, figsize, **kwds)
   2113         values = self.dropna().values
   2114
-> 2115         ax.hist(values, **kwds)
   2116         ax.grid(grid)
   2117         axes = np.array([ax])

C:\portabel\Python27\lib\site-packages\matplotlib\axes.pyc in hist(self, x, bins, range, normed, weights, cumulative, bottom, histtype, align, orientation, rwidth, log, color, label, stacked, **kwargs)
   8325             # this will automatically overwrite bins,
   8326             # so that each histogram uses the same bins
-> 8327             m, bins = np.histogram(x[i], bins, weights=w[i], **hist_kwargs)
   8328             m = m.astype(float) # causes problems later if it's an int
   8329             if normed and not stacked:

C:\portabel\Python27\lib\site-packages\numpy\lib\function_base.pyc in histogram(a, bins, range, normed, weights, density)
    174             else:
    175                 range = (a.min(), a.max())
--> 176         mn, mx = [mi+0.0 for mi in range]
    177         if mn == mx:
    178             mn -= 0.5

TypeError: coercing to Unicode: need string or buffer, float found
Comment From: jorisvandenbossche
This also does not work with matplotlib (eg plt.hist([u"abc", u"bcd", u"cde", u"abc"])), although with another error. So maybe mark an issue there.
But should it work with non numeric data? A histogram is about binning? Maybe a better error message is possible.
Comment From: cpcloud
@JanSchulz What would you expect to happen here? Non-numeric data don't really make sense for a histogram, because nominal data (such as strings) don't have an ordering, can't be added together numerically and don't have any sort of multiplication operation that's germane to computing a histogram.
That said, I agree with @jorisvandenbossche that the error message could be a bit less cryptic.
Comment From: dragoljub
I have noticed series.hist() also fails for datetime64ns series. It would be cool if we could handle this. I'm not sure how NumPy/MatplotLib computes the bucketing on these value types to get the histogram. If its just 64bit ints underlying then it should not be too hard to bucket with datetime bin edges.
Comment From: jreback
value_counts handles all of the dtypes, so easy enough to prob just catch the error, do a value_counts and retry
In [4]: df['name'].value_counts()
Out[4]:
abc    2
cde    1
bcd    1
dtype: int64

In [5]: df['name'].value_counts().hist()
Out[5]: <matplotlib.axes.AxesSubplot at 0x30fb250>

In [6]: df['name'].hist()

TypeError: coercing to Unicode: need string or buffer, float found
Comment From: jankatins
Actually I expected a bar plot (value -> count). So in the above example I wanted to have three bars, labels are "abc", "cde", "bcd" with the length of the bars 2, 1, 1.
Usung plot with kind=bar also fails:
s = df["name"]
s.plot(kind='bar')
---------------------------------------------------------------------------
TypeError                                 Traceback (most recent call last)
<ipython-input-30-0d9dfbe49ce9> in <module>()
      1 s = df["name"]
----> 2 s.plot(kind='bar')

C:\portabel\Python27\lib\site-packages\pandas\tools\plotting.pyc in plot_series(series, label, kind, use_index, rot, xticks, yticks, xlim, ylim, ax, style, grid, legend, logx, logy, secondary_y, **kwds)
   1797                      secondary_y=secondary_y, **kwds)
   1798
-> 1799     plot_obj.generate()
   1800     plot_obj.draw()
   1801

C:\portabel\Python27\lib\site-packages\pandas\tools\plotting.pyc in generate(self)
    874     def generate(self):
    875         self._args_adjust()
--> 876         self._compute_plot_data()
    877         self._setup_subplots()
    878         self._make_plot()

C:\portabel\Python27\lib\site-packages\pandas\tools\plotting.pyc in _compute_plot_data(self)
    955         if is_empty:
    956             raise TypeError('Empty {0!r}: no numeric data to '
--> 957                             'plot'.format(numeric_data.__class__.__name__))
    958
    959         self.data = numeric_data

TypeError: Empty 'Series': no numeric data to plot
df["name"].value_counts().hist() is not what I wanted: this does a histogram over the count values, so ends up in the above case with two bars, one for '1' (length two, as 1 is two times present) and one for '2' with length 1.
Comment From: jankatins
Thats what I wanted:
df["name"].value_counts().plot(kind="bar")
:-)
Comment From: themrmax
I really want this feature, since most of the data I deal with is categorical, and so I can never use the convenience of hist. (This is also relevant to https://github.com/pydata/pandas/issues/8712 and maybe https://github.com/pydata/pandas/issues/10254) Philosophically, I think this type of behaviour could be seen as more like an enhancement for bar, rather than hist for example in R, by default geom_bar will plot the value counts; you only get the actual values if you pass stat="identity" (opposite of the behaviour of pandas.plot.bar). So maybe this could also be referenced inside BarPlot via an optional value_counts flag.
I've hacked together something which provides this functionality using the Pandas DataFrame.plot API. Would this be suitable for merging into tools.plotting? My concern is that tools.plotting is mostly written using native calls to matplotlib, is it a problem to have calls to a Pandas API inside this library.
Apologies if this is a dumb question, or if I'm rasing this in the wrong place, this would be my first contribution to Pandas and I'm having trouble wrapping my head around exactly where this fits in.
def categorical_hist(data,column=None,by=None,layout=None,legend=None,**params):
  """
      Draw a bar plot of value counts. If layout=none, layout will be a square
      grid, overriding the DataFrame.plot default of a single column of
      stacked plots

      Parameters
      ----------
      data : DataFrame or Series
      column : object, optional
          the column to plot (only valid if data is a dataframe)
      by : object optional
          if passed, then used to form bar plots for separate groups
      layout : (int,int), optional
          a tuple (width, height) of the subplots grid
      legend : False/True/'reverse'
          place legend on axis subplots
      kwds : other plotting keyword arguments

  """
  from math import sqrt, ceil
  from pandas import DataFrame

  if column is None: column = data.name #if data is a Series, need to set this
  data = DataFrame(data) #if data is a series, make it a DataFrame

  if by is not None:
    if layout==None:
      s = ceil(sqrt(data[column].unique().size))
      layout = (s,s)
    data = data.groupby(by).value_counts().sort_index().unstack()
    return data[column].plot.bar(subplots=True,layout=layout,
                                 legend=legend,**params)
  return data[column].value_counts().plot.bar(subplots=False,layout=layout,
                                              legend=legend,**params)
Comment From: datapythonista
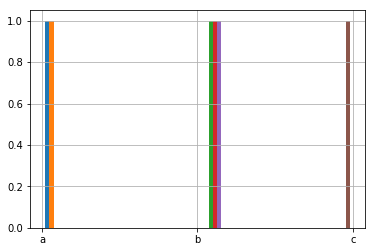
This doesn't raise an error anymore, it generates a plot. Not sure if the plot is meaningul, it's not equivalent to df["name"].value_counts().plot(kind="bar"). May be we can review in a separate issue the content of the plot, if that hasn't already been reported. Closing this issue.
Example output:
pandas.Series(['a', 'a', 'b', 'b', 'b', 'c'], dtype='object').hist()