I use quite frequently log scaled histograms with histtype='step' option.
I noticed that with the suggested default display.mpl_style (which I like), readability of such histograms is quite improvable.
Consider this (from ipython notebook)
%pylab inline

import pandas as pd
import numpy as np
import matplotlib
import matplotlib.pyplot as plt

matplotlib.rcParams['savefig.dpi'] = 300

pd.set_option('display.mpl_style', 'default')

val = np.random.normal(size=1000000)
val2 = np.random.normal(scale = .5, size=1000000)
df = pd.DataFrame({'A' : val , 'B' : val2 , 'C' : val2})

df.hist(bins = 80, log=True,histtype='step')

plt.figure()
df.A.hist(bins = 80 , log=True,histtype='step',normed=True )
df.B.hist(bins = 80 , log=True,histtype='step',normed=True )
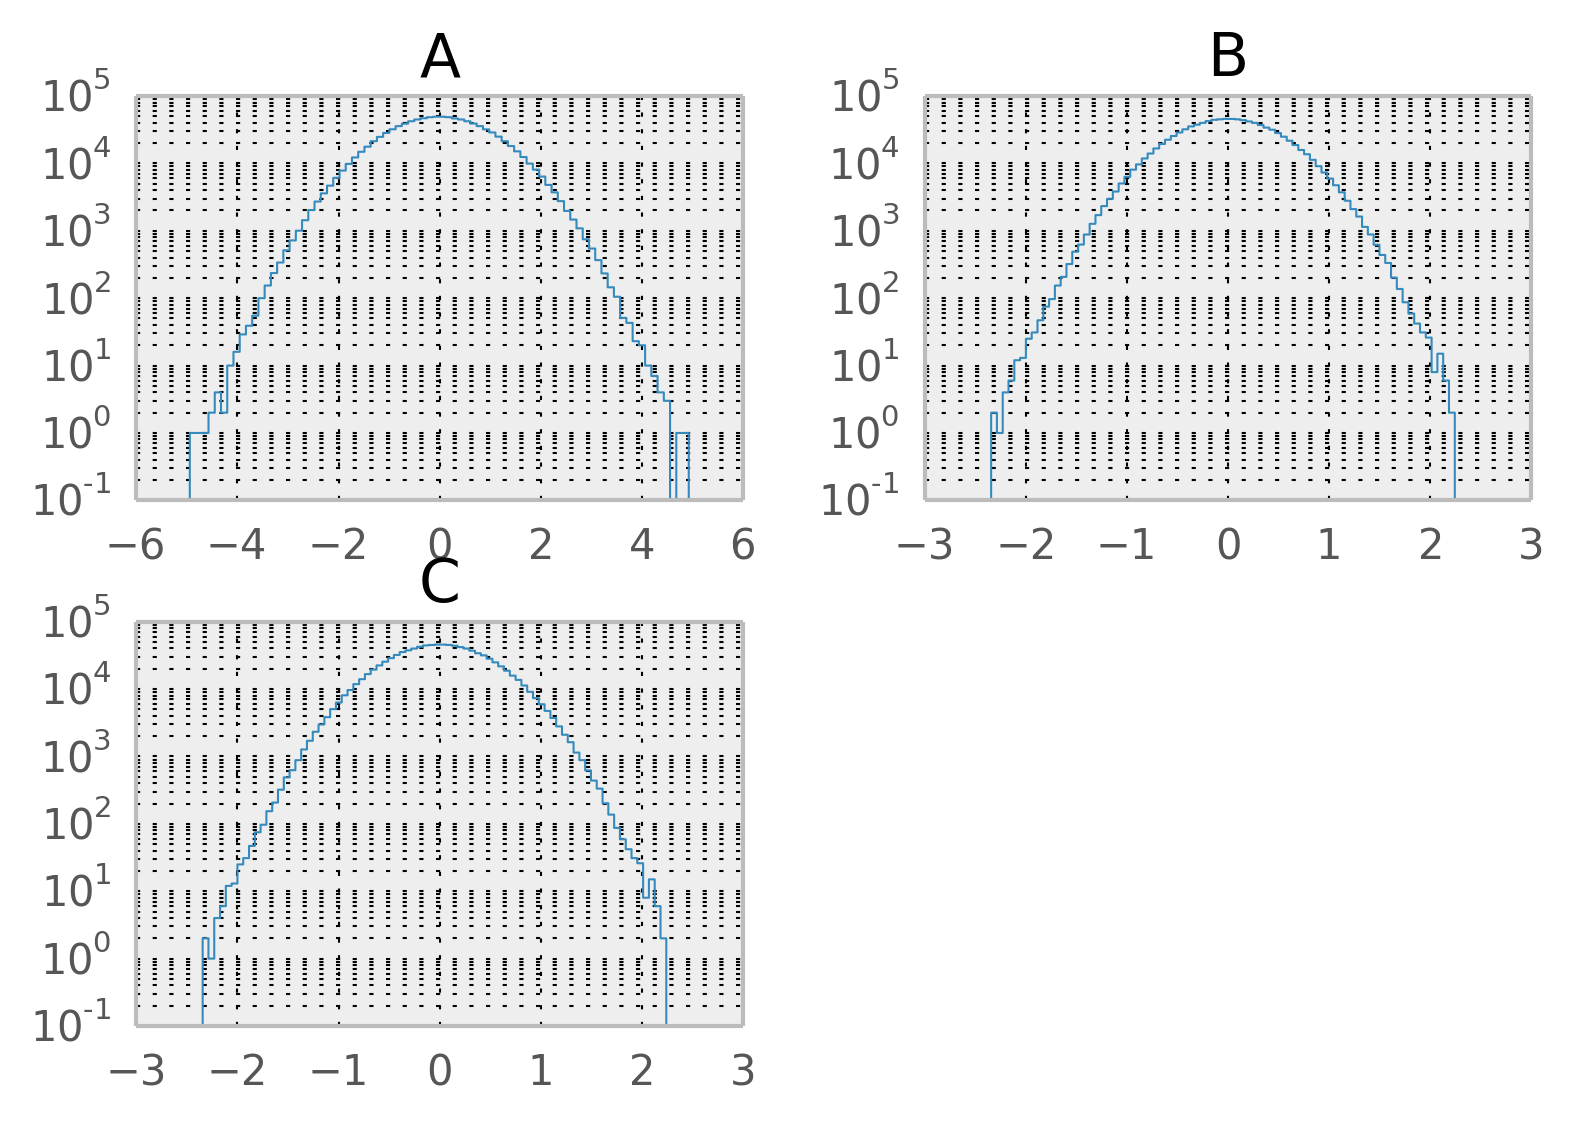
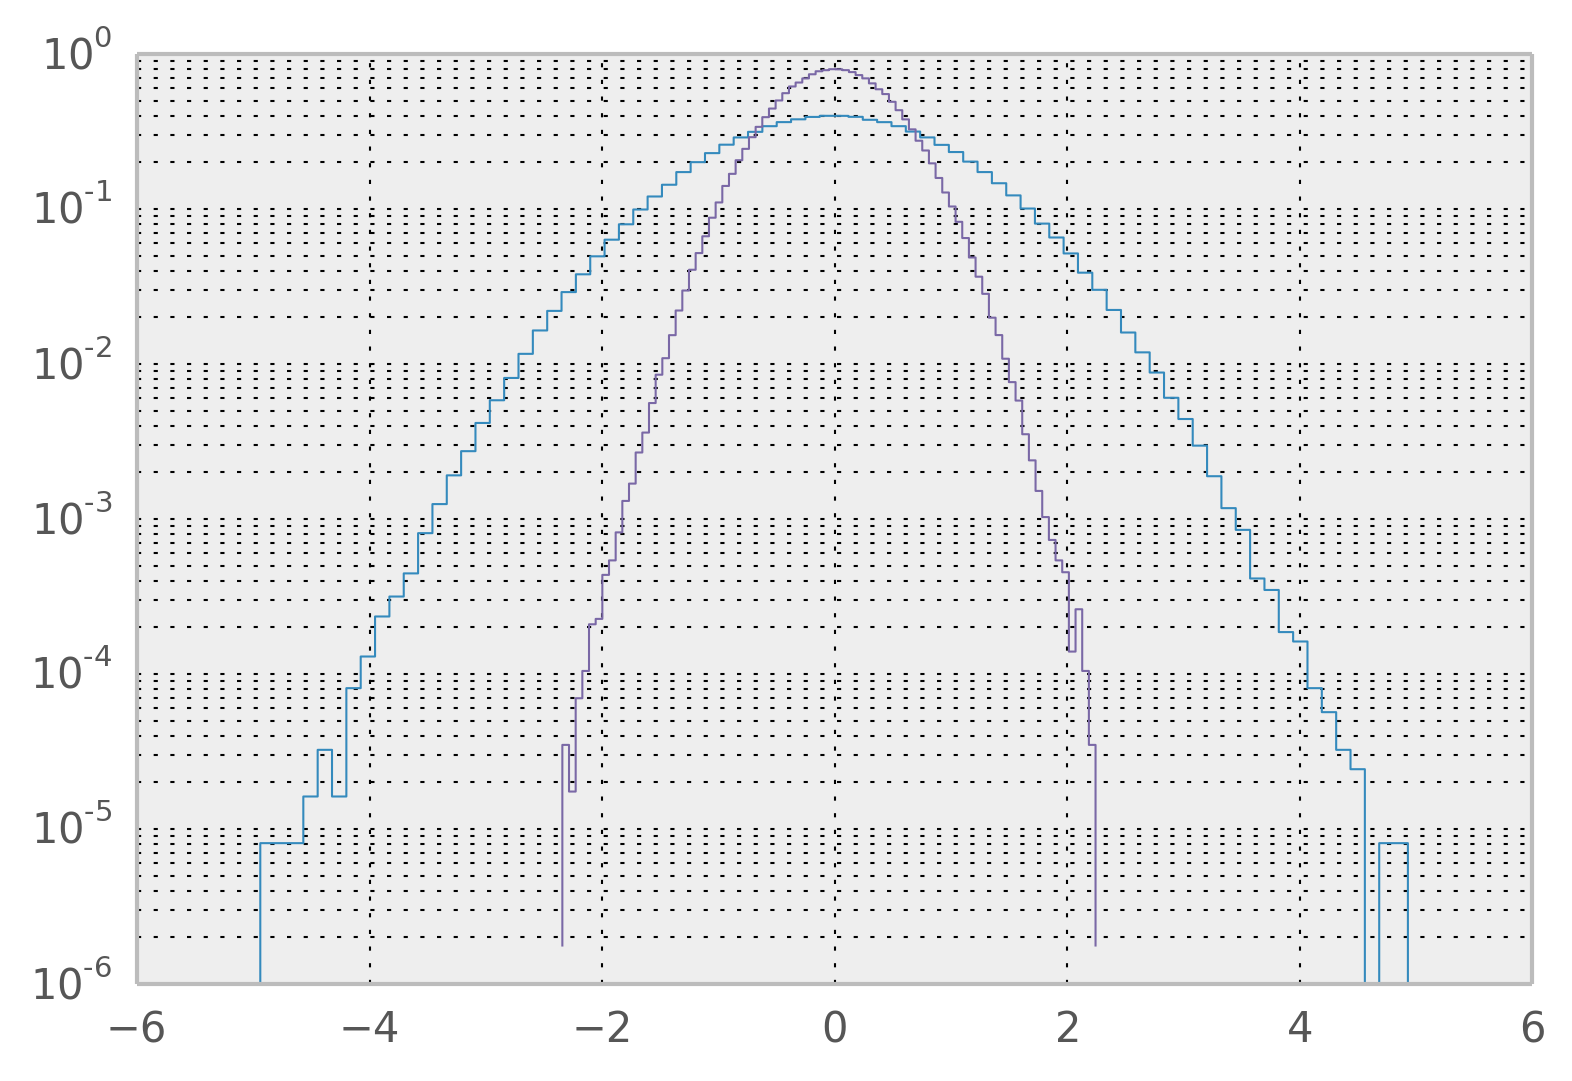
The secondary grid looks too thick and confusing; IMHO it damages readability. This problem shows up only with log scaled hist.
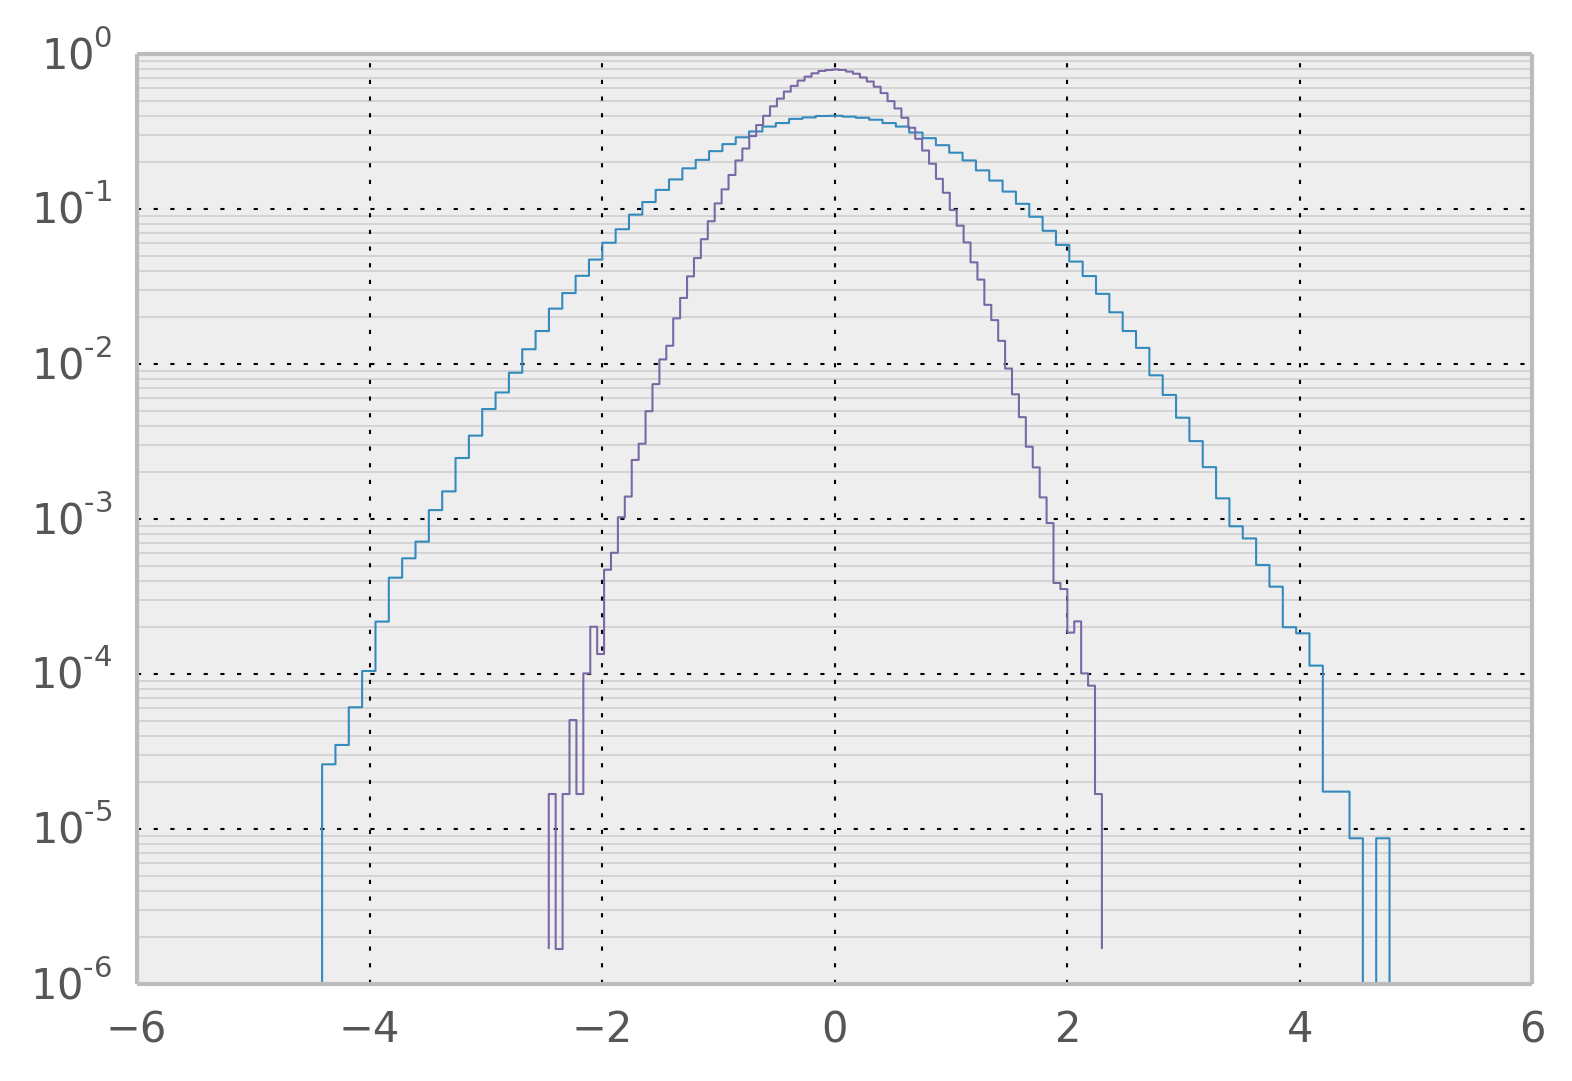
Consider the following as a comparison
Comment From: acorbe
Hi, @jreback
if you think it is useful I can make a PR containing the modification to the mpl_style which generated the latter plot.
I've no idea If readability of other kind of plots can be broken down, though.
Comment From: jreback
@TomAugspurger @cpcloud ?
Comment From: cpcloud
What is the mpl style option that needs to be changed?
Comment From: acorbe
@cpcloud This does the job
fix_minor_grid = lambda : plt.grid(b=False, which='minor', linestyle='-',linewidth=.05)
I assume it can be merged with the style. I have to give a deeper look, though.
Comment From: jreback
@cpcloud @TomAugspurger close / put on for 0.15?
Comment From: jorisvandenbossche
Closing this since display.mpl_style is deprecated now