Right now its easy to plot columns as rows like this:
df.plot(subplots=True, layout = (15, 1),legend=False) # for a 300x15 dataframe
which gives very nice row plots like this:
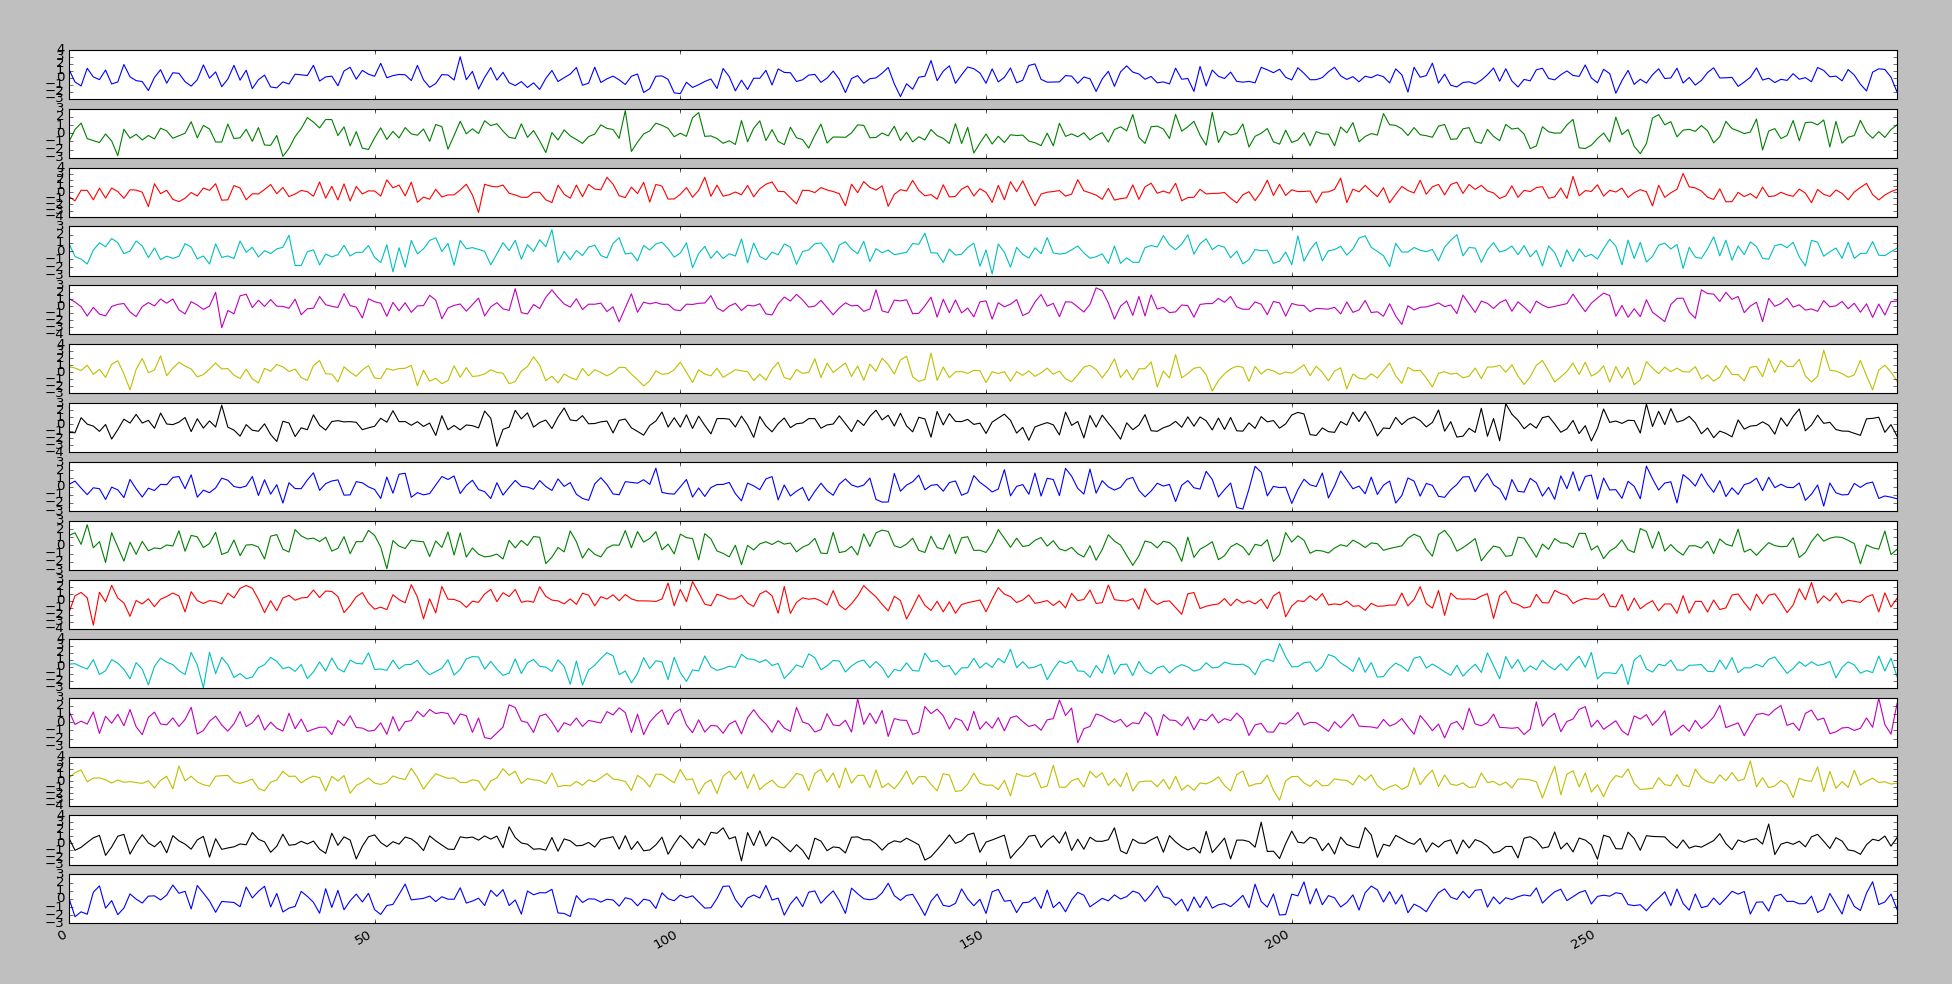
However sometimes it is needed to also plot this as columns instead - so basically swap x and y axes on each subplot. ie. its not enough to just transpose the df before plotting because its the plotting that needs to be transposed and not the data. Is this possible already somehow? If not, could this possibly be implemented ?
Comment From: TomAugspurger
If it's the plotting that needs to change, I think that'd be better handled upstream in matplotlib, not pandas.
There's a bit here about doing this. You would need to apply that to each of your subplots, and then adjust the xlim and ylim.
Finally, you might be able to do this by making the axes ahead of time, and then iterating over the columns. df is just a 300 x 15 DataFrame
In [34]: fig, axes = plt.subplots(nrows=1, ncols=15)

In [36]: for ax, col in zip(axes, df.columns):
    ...:     ax.plot(df[col], df.index)
Comment From: bsdis
ok i see - It would be elegant with a transpose_plot = True/False i think. If i made a PR with that feature, would it get accepted?
Comment From: jorisvandenbossche
I personally think this would be out of scope for pandas.
See also the code snippet @TomAugspurger hinted, it should be fairly straightforward to create such a plot manually.