Code Sample
import pandas as pd

x = [0, 1, 2, 3, 4]
res = pd.cut(x, (0, 2, 4), include_lowest=True)
print(res, '\n')

for val in res:
    print(repr(val))
Output
[(-0.001, 2.0], (-0.001, 2.0], (-0.001, 2.0], (2.0, 4.0], (2.0, 4.0]]
Categories (2, interval[float64]): [(-0.001, 2.0] < (2.0, 4.0]]

Interval(-0.001, 2.0, closed='right')
Interval(-0.001, 2.0, closed='right')
Interval(-0.001, 2.0, closed='right')
Interval(2.0, 4.0, closed='right')
Interval(2.0, 4.0, closed='right')
Problem description
The correct cutting behaviour but the labels are awkward (given the input), they leak the internal adjustments used to do the cutting. The expected output has precise intervals/labels. This is a regression from the previous version 0.19.2.
Expected Output
[[0, 2], [0, 2], [0, 2], (2, 4], (2, 4]]
Categories (2, interval[int64]): [[0, 2] < (2, 4]]

Interval(0, 2, closed='both')
Interval(0, 2, closed='both')
Interval(0, 2, closed='both')
Interval(2, 4, closed='right')
Interval(2, 4, closed='right')
Output of pd.show_versions()
Comment From: has2k1
I have seen PR #15309, looked at the code for pd.cut and IntervalIndex, it is quiet thorny and it looks like the change in API for pd.cut is a by product of the difficult implementation. I have also discovered this:
pd.Categorical([pd.Interval(0, 2, 'both'), pd.Interval(2, 4, 'right')])
# ValueError: intervals must all be closed on the same side
So, the expected input posted above does not indicate an unknown issue. Also, the meaning of the right parameter has changed from this:
Indicates whether the bins include the *rightmost* edge or not.
to this:
Indicates whether the bins include the *right* edge or not.
So it seems like to get back the old (and still documentated) meaning, the vectors of the IntervalIndex type must be allowed to have intervals that are not all closed on the same side. This change need not be chaotic, the restriction could be narrowed to "internal invervals must all be closed on the same side".
Would this change come with any disastrous consequences?
Comment From: jreback
In the prior implementation it was allowed to have mixed intervals, IOW, ones that didn't conform in a uniform way. This is not allowed directly from .cut, though you could construct it manually I suppose. It is completely non-performant.
In [5]: pd.cut(range(5), (0, 2, 4), include_lowest=True)
Out[5]:
[(-0.001, 2.0], (-0.001, 2.0], (-0.001, 2.0], (2.0, 4.0], (2.0, 4.0]]
Categories (2, interval[float64]): [(-0.001, 2.0] < (2.0, 4.0]]

In [6]: pd.cut(range(5), (0, 2, 4))
Out[6]:
[NaN, (0, 2], (0, 2], (2, 4], (2, 4]]
Categories (2, interval[int64]): [(0, 2] < (2, 4]]
This is not a regression but eliminates a non-tested / non-documented case, which IMHO is pretty useless.
It is theoretically possible to support it in an index, but you would need a clear cut usecase.
Comment From: jreback
If you really really needed to replicate this, you can do this.
In [4]: pd.cut(range(5), (0, 2, 4), include_lowest=True, labels=['[0, 2]', '(2, 4)'])
Out[4]:
[[0, 2], [0, 2], [0, 2], (2, 4), (2, 4)]
Categories (2, object): [(2, 4) < [0, 2]]
This is supported as much as scalar labels are, meaning you can directly index them, but this is NOT an IntervalIndex.
Comment From: has2k1
Here is a minimal usecase
import pandas as pd
from plotnine import *

df = pd.DataFrame({'x': range(5),
                   'y': range(5),
                   })

p = (ggplot(df, aes('x', 'y'))
     + geom_point()
     + facet_wrap('pd.cut(x, 2, include_lowest=True)')
     + lims(x=(0, 4))
   )

print(p)
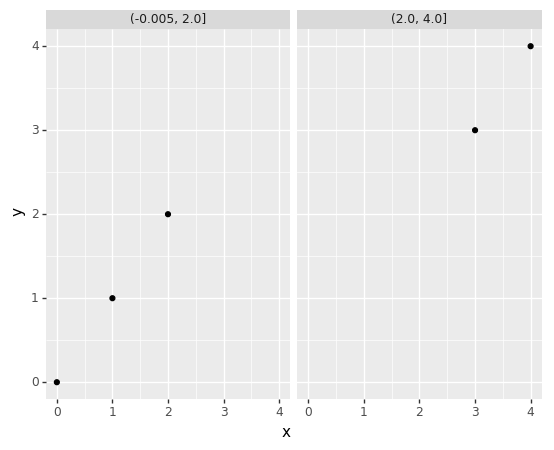
The labels to the panels are not precise, so you would have to reexamine the data limits to be certain of what data is at the edges. Second, integers that can be otherwise cut along integer lines have floating-point artefacts. These two issues add up when the code that generates the plots is a script not amendable to changes specific to the data currently being plotted.
Another usecase -- planned for the plotting system -- is a tree faceting feature. In this case without automatic precise intervals/labels I envision a more gnarly tree generating algorithm.
Comment From: shoyer
I have seen PR #15309, looked at the code for pd.cut and IntervalIndex, it is quiet thorny and it looks like the change in API for pd.cut is a by product of the difficult implementation.
Yes, I think this summarizes things correctly.
I agree that exposing a floating point lower bound is non-ideal. This was the simplest thing to do for IntervalIndex, but we should have discussed it more before making this change in the 0.20 release.
I think IntervalIndex could indeed be adjusted to accommodate an external interval that is closed on both sides -- and this might be the nicest solution, especially if the more complex indexing behavior is not really needed -- but it would indeed take some work to make this happen.
Comment From: gfyoung
Closing since this was just a usage question.