Code Sample from Stamford
[http://stamfordresearch.com/linear-regression-using-pandas-python/](url) (original code)

[](url)
import numpy as np
import pandas as pd
import matplotlib.pyplot as plt

data = pd.DataFrame ({
'length' : [94,74,147,58,86,94,63,86,69,72,128,85,82,86,88,72,74,61,90,89,68,76,114,90,78],
'weight' : [130,51,640,28,80,110,33,90,36,38,366,84,80,83,70,61,54,44,106,84,39,42,197,102,57]
})

# create another data frame of log values
data_log = np.log(data)


# ========================
# Model for Original Data
# ========================

lm_original = np.polyfit(data.length, data.weight, 1)
polynomial = np.poly1d(lm_original)
y =polynomial(data.length)

lm_original_plot=pd.DataFrame({
    'length': data.length,
    'weight': y
        })

# ========================
# Model for Log Data
# ========================

# Get the linear models
lm_log = np.polyfit(data_log.length, data_log.weight, 1)

# calculate the y values based on the co-efficients from the model
r_x, r_y = zip(*((i, i*lm_log[0] + lm_log[1]) for i in data_log.length))

# Put in to a data frame, to keep is all nice
lm_log_plot = pd.DataFrame({
'length' : r_x,
'weight' : r_y
})


# ========================
# Plot the data
# ========================
fig, axes = plt.subplots(nrows=1, ncols=2)

# Plot the original data and model
data.plot(kind='scatter', color='Blue', x='length', y='weight', ax=axes[0],title='Original Values')
lm_original_plot.plot(kind='line', color='Red', x='length', y='weight', ax=axes[0])

# Plot the log transformed data and model
data_log.plot(kind='scatter', color='Blue', x='length', y='weight', ax=axes[1], title='Log Values')
lm_log_plot.plot(kind='line', color='Red', x='length', y='weight', ax=axes[1])

plt.show()
Problem description
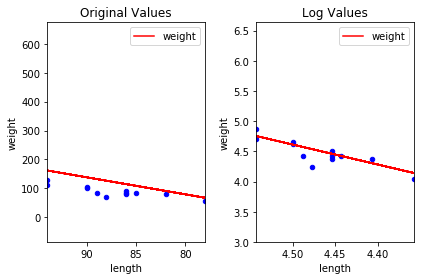
Pandas doesn't plot the expected graph as the website mention in it. the bug is at this line: data.plot(kind='scatter', color='Blue', x='length', y='weight', ax=axes[0],title='Original Values') lm_original_plot.plot(kind='line', color='Red', x='length', y='weight', ax=axes[0]) The x-axis data is being flipped when pandas try to plot it.
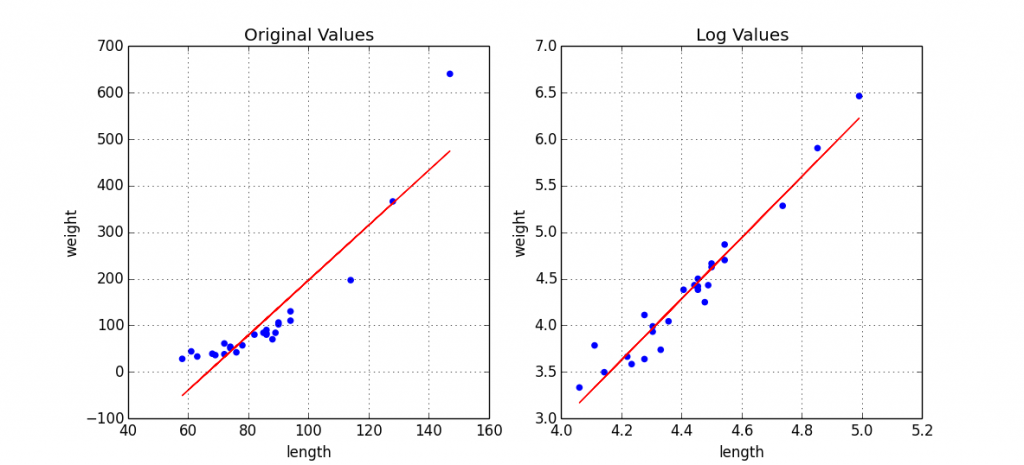
Expected Output
Output of pd.show_versions()
Comment From: TomAugspurger
Can you simplify the problem, and narrow down what the exact bug is?
Comment From: lumylovepandas
The bug is at this line: data.plot(kind='scatter', color='Blue', x='length', y='weight', ax=axes[0],title='Original Values') lm_original_plot.plot(kind='line', color='Red', x='length', y='weight', ax=axes[0])
Please observe the x-axis line, the data is 90, 85, 80, the sequence is reversed. It suppose to be linear in sequence.
Comment From: TomAugspurger
Could you simplify the example output then? You should be able to construct a simple dataframe or series that shows the unexpected output. No need for any of the regression stuff.
I'd like the example to be as simple as possible, so we can clarify what the point of confusion is. I think pandas may be behaving as intended here, but I'd like to make sure first.
Comment From: lumylovepandas
I can't simplify the output as you wish, you need to click the link and study the example.
Comment From: TomAugspurger
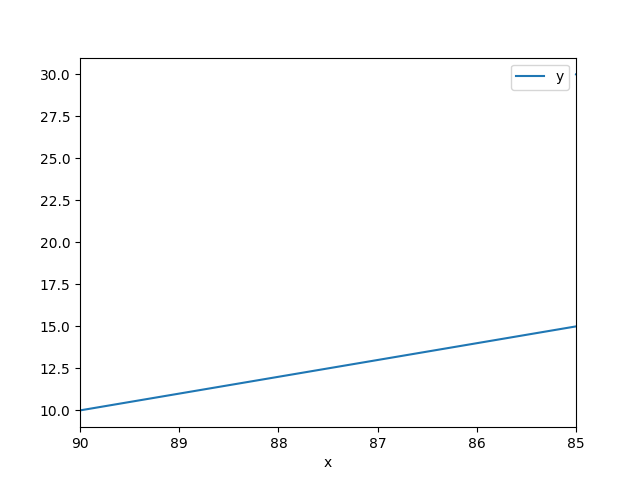
@lumylovepandas here's a minimal example that demonstrates the problem
import pandas as pd
df = pd.DataFrame({"x": [90, 80, 85], "y": [10, 20, 30]})
ax = df.plot(x='x', y='y')
Since this doesn't have any extraneous information (like data generation, regression, additional plots) it's easier to see that it's a duplicate of https://github.com/pandas-dev/pandas/issues/10118. Could you post there if you have feedback? It'd be valuable to have additional voices there. I can see why the current output is surprising, and it's probably just an implementation detail that's exposed to the user.