Problem description
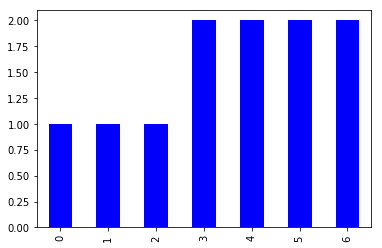
color attribute in pd.Series/pd.DataFrame works wrong (not same as color in ax.bar) when I specify a color for each bar
%matplotlib inline
import matplotlib
import matplotlib.pyplot as plt
import pandas as pd
import numpy as np

data = pd.Series([1]*3+[2]*4)
data
0    1
1    1
2    1
3    2
4    2
5    2
6    2
colors={1:'b', 2:'g'}
data.map(colors)
0    b
1    b
2    b
3    g
4    g
5    g
6    g
data.plot(kind='Bar', color=data.map(colors))
_, ax = plt.subplots()
ax.bar(range(len(data)), data, color=data.map(colors))
plt.show()

#### Output of ``pd.show_versions()``
INSTALLED VERSIONS
------------------
commit: None
python: 3.5.2.final.0
python-bits: 64
OS: Linux
OS-release: 4.4.0-81-generic
machine: x86_64
processor: x86_64
byteorder: little
LC_ALL: None
LANG: en_US.UTF-8
LOCALE: en_US.UTF-8

pandas: 0.20.3
pytest: None
pip: 9.0.1
setuptools: 20.7.0
Cython: None
numpy: 1.13.1
scipy: 0.19.1
xarray: None
IPython: 6.1.0
sphinx: None
patsy: None
dateutil: 2.6.1
pytz: 2017.2
blosc: None
bottleneck: None
tables: None
numexpr: None
feather: None
matplotlib: 2.0.2
openpyxl: None
xlrd: None
xlwt: None
xlsxwriter: None
lxml: None
bs4: None
html5lib: 0.999999999
sqlalchemy: None
pymysql: None
psycopg2: None
jinja2: 2.9.5
s3fs: None
pandas_gbq: None
pandas_datareader: None
Comment From: TomAugspurger
Looks similar to https://github.com/pandas-dev/pandas/issues/16822 (that was for lists, not dicts, but I suspect it's the same underlying problem).
Any interest in taking a look and submitting a fix?
Comment From: avkitex
@TomAugspurger Sure, it is