https://github.com/pandas-dev/pandas/blob/3a7f956c30528736beaae5784f509a76d892e229/pandas/plotting/_core.py#L2649-L2666
import pandas as pd
import numpy as np
import matplotlib
get_ipython().magic(u'pylab inline')
# In[17]:
df = pd.DataFrame({'id': range(1,11), 'normcolor': np.random.rand(10), 'count': np.random.randint(0,100,(10))})
# In[21]:
colors = matplotlib.cm.hsv(df['normcolor'])
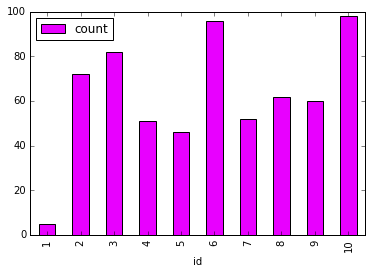
df.plot.bar('id','count', color=colors) # return plot with not color variation
# In[22]:
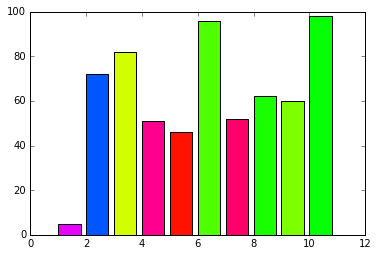
plt.bar(df['id'], df['count'], color=colors) # returns plot as expected
Current Output
Correct Output
Comment From: rajgupt
import pandas as pd
pd.show_versions()
INSTALLED VERSIONS
commit: None python: 2.7.12.final.0 python-bits: 32 OS: Windows OS-release: 10 machine: x86 processor: x86 Family 6 Model 58 Stepping 9, GenuineIntel byteorder: little LC_ALL: None LANG: None LOCALE: None.None
pandas: 0.20.3 pytest: 2.8.5 pip: 9.0.1 setuptools: 23.0.0 Cython: 0.23.4 numpy: 1.13.1 scipy: 0.19.1 xarray: None IPython: 4.2.0 sphinx: 1.3.5 patsy: 0.4.0 dateutil: 2.4.2 pytz: 2015.7 blosc: None bottleneck: 1.0.0 tables: 3.2.2 numexpr: 2.6.2 feather: None matplotlib: 1.5.1 openpyxl: 2.3.2 xlrd: 0.9.4 xlwt: 1.0.0 xlsxwriter: 0.8.4 lxml: 3.5.0 bs4: 4.4.1 html5lib: None sqlalchemy: 1.0.11 pymysql: None psycopg2: None jinja2: 2.8 s3fs: None pandas_gbq: None pandas_datareader: None None
Comment From: chris-b1
duplicate of #16822, PR to fix welcome! From that issue, df.plot.bar('id','count', color=[colors]) is apparently a workaround.