Code Sample, a copy-pastable example if possible
import pandas as pd
df = pd.DataFrame({'y': [3.5, 4.5, 6.5]}, index=[2.5, 1.5, 3.5])
df.plot(style='o')
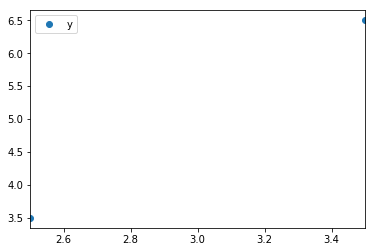
Problem description
This above may or may not be expected behaviour, but it did catch me by surprise: The range of the horizontal axis will be [2.5, 3.5], even though one of the data points has an index value outside that range.
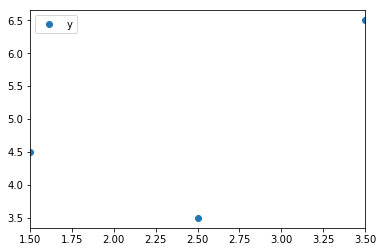
Expected Output
Instead, I would have expected the output currently obtainable through df.sort_index().plot(style='o'):
Output of pd.show_versions()
Comment From: bobhaffner
I tested this in the latest master branch and it matches your expected output.
This means that this will be fixed in the next release
I believe this commit fixed it https://github.com/pandas-dev/pandas/pull/16600
Comment From: jreback
@bobhaffner is there a test for this in master? if not would u do a PR for one?
Comment From: bobhaffner
Hi @jreback, Yes, I'll check it out
Comment From: bobhaffner
@jreback It looks like test_unsorted_index_lims covers this case
Comment From: jreback
thanks!
Comment From: bobhaffner
No problem @jreback Thanks for closing this, @TomAugspurger
Comment From: fuglede
And thanks for looking into it; indeed, it looks like this one was a duplicate of #11471.