Observed in pandas 0.17.0 and the current development version (d78266e).
It seems to me that pandas fail to align timeseries plots with different frequency unit (or no frequency) when they are drawn on different axes with one shared axis. The issue does not occur if the two timeseries are plotted on the same axes.
Example:
"""Shared axes between timeseries plots of different frequency."""

import numpy as np
import pandas as pd
import matplotlib.pyplot as plt
pd.show_versions()

# prepare a random time series
t = pd.date_range('1/1/2000', periods=1000)
x = np.random.randn(1000)
ts = pd.Series(x, index=t).cumsum()

# initialize figure
fig, (ax1, ax2, ax3) = plt.subplots(3, 1, sharex=True)

# plot original and resampled timeseries
ts.plot(ax=ax1)                 # works as expected
ts.resample('30D').plot(ax=ax2) # works as expected
ts.resample('1M').plot(ax=ax3)  # seem to mess up x axis

# show
plt.show()
After the third series is drawn, the first two appear shifted out of the frame to wrong x-coordinates.
Version info:
INSTALLED VERSIONS
------------------
commit: None
python: 2.7.3.final.0
python-bits: 64
OS: Linux
OS-release: 3.2.0-4-amd64
machine: x86_64
processor:
byteorder: little
LC_ALL: None
LANG: en_US.UTF-8

pandas: 0.17.0+159.gd78266e
nose: 1.3.7
pip: 7.1.2
setuptools: 14.3.1
Cython: 0.22
numpy: 1.10.1
scipy: 0.16.0
statsmodels: None
IPython: 0.13.1
sphinx: 1.3.1
patsy: None
dateutil: 2.4.2
pytz: 2015.7
blosc: None
bottleneck: None
tables: None
numexpr: None
matplotlib: 1.5.0
openpyxl: None
xlrd: None
xlwt: None
xlsxwriter: None
lxml: None
bs4: None
html5lib: None
httplib2: 0.7.4
apiclient: None
sqlalchemy: 0.7.8
pymysql: None
psycopg2: 2.4.5 (dt dec mx pq3 ext)
Thanks!
Comment From: Stigmaru
@juseg Julien did you ever figure this misalignment problem out? I am running into same problem plotting two signals at different frequencies. MATLAB can do it using Linkaxes property, but I don't believe Python's sharex property is exactly the same thing.
Comment From: juseg
@AeroWRX I updated the script above for changes in the resample API (cf v0.18.0 changelog) and tested against pandas 0.23.1.
ts.resample('30D').mean().plot(ax=ax2) # works as expected
ts.resample('1M').mean().plot(ax=ax3) # seem to work now
The resulting figure has aligned x-axes. I think the issue has been solved. I am don't know about Matlab.
INSTALLED VERSIONS
------------------
python: 2.7.15.final.0
pandas: 0.23.1
numpy: 1.14.5
matplotlib: 2.2.2
Comment From: juseg
The above code seems to work in the more recent pandas versions. On the other hand combining pandas ts.plot() with matplotlib ax.plot() methods produces wrong results as for the above referenced other issues.
Comment From: astrojuanlu
I am observing that plotting series with different frequencies and data densities produces misaligned plots and I think it might be related by this bug, but several similar ones have been reported (#29705, #11574, #18571) so I'm not 100 % sure. To reproduce:
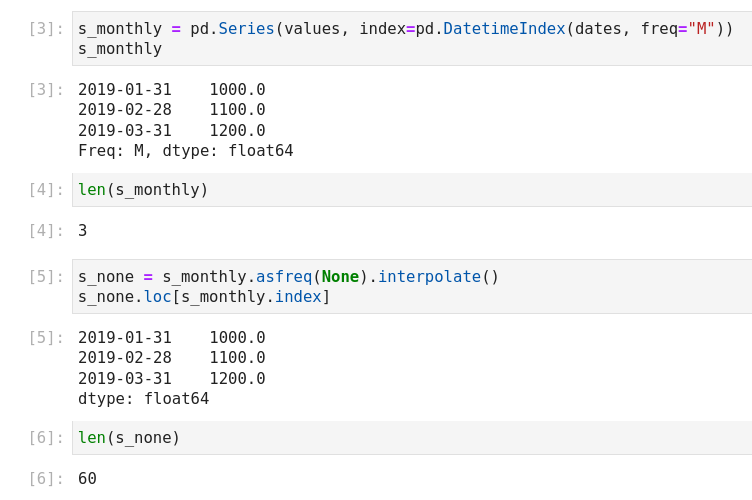
import pandas as pd
dates = ["2019-01-31", "2019-02-28", "2019-03-31"]
values = [1000.0, 1100.0, 1200.0]
s_monthly = pd.Series(values, index=pd.DatetimeIndex(dates, freq="M"))
s_none = s_monthly.asfreq(None).interpolate()
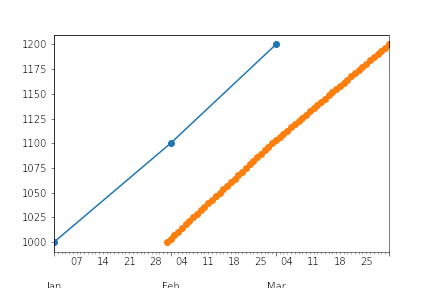
ax = s_monthly.plot(marker="o")
s_none.plot(marker="o", ax=ax)
ax.figure.savefig("pandas_misalignment_bug.png")
Data:
Result:
Comment From: madhuramkumar
Has this issue been fixed? If not I would love to contribute to it.
Comment From: palbha
@rhshadrach - I could see the issue still exist in pandas =2.2.3 Let me know if this needs work ?

Comment From: rhshadrach
@palbha - I would recommend testing on the main branch of pandas in general, but likely you'll see the same behavior there. As indicated in https://github.com/pandas-dev/pandas/issues/11574#issuecomment-1025234847, it looks to me like this is a bug and needs fixed.