Pandas version checks
-
[x] I have checked that this issue has not already been reported.
-
[x] I have confirmed this bug exists on the latest version of pandas.
-
[x] I have confirmed this bug exists on the main branch of pandas.
Reproducible Example
datetime_list = [datetime.datetime(year = 2025, month = 1, day = 1, hour = n) for n in range(23)]
y = [n for n in range(23)]

df = pd.DataFrame(columns = ['datetime','y'])
for i, n in enumerate(datetime_list):
    df.loc[len(df)] = [n,y[i]]

#Plotting with pandas - first subplot shows up as blank
fig, ax = plt.subplots(2, sharex=True)
df.plot.scatter(x = 'datetime', y = 'y', ax = ax[0])
df.plot(x = 'datetime', y = 'y', ax = ax[1])

#Plotting with matplotlib - this works
fig, ax = plt.subplots(2, sharex=True)
ax[0].scatter(df['datetime'],df['y'])
ax[1].plot(df['datetime'],df['y'])
Issue Description
When I am trying to plot a line plot and scatter plot using df.plot and df.plot.scatter, the scatter plot shows up as blank when I select sharex=True when making the figure and axes.
#Plotting with pandas - first subplot shows up as blank
fig, ax = plt.subplots(2, sharex=True)
df.plot.scatter(x = 'datetime', y = 'y', ax = ax[0])
df.plot(x = 'datetime', y = 'y', ax = ax[1])

However, if I plot using the standard matplotlib way of plotting (ax.scatter and ax.plot), both subplots show up correctly when I set sharex=True for the figure.
#Plotting with matplotlib - this works
fig, ax = plt.subplots(2, sharex=True)
ax[0].scatter(df['datetime'],df['y'])
ax[1].plot(df['datetime'],df['y'])
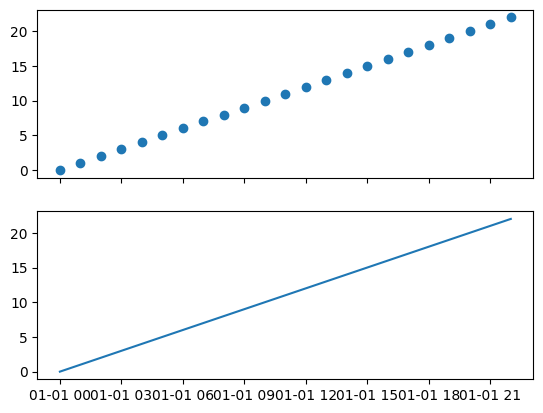
Expected Behavior
I would expect for the both subplots to show up, not blank. The behavior should be more similar to the traditional way of plotting with matplotlib.
Installed Versions
Comment From: snitish
I was able to reproduce the bug on main. This seems to be due to the two plots (scatter and line) having different xaxis types. The scatter plot keeps the 'datetime' column as is, but the line plot converts it to a PeriodIndex due to
https://github.com/pandas-dev/pandas/blob/d1ec1a4c9b58a9ebff482af2b918094e39d87893/pandas/plotting/_matplotlib/core.py#L1543
I was able to fix this by setting x_compat = True in the line plot:
df.plot(x = 'datetime', y = 'y', ax=ax[1], x_compat=True)
For a more robust fix, I'm guessing we should probably support automatic tick resolution in scatter plots similar to line plots?