Pandas version checks
-
[x] I have checked that this issue has not already been reported.
-
[x] I have confirmed this bug exists on the latest version of pandas.
-
[x] I have confirmed this bug exists on the main branch of pandas.
Reproducible Example
import matplotlib.pyplot as plt
import pandas as pd
import numpy as np

df = pd.DataFrame([(30, 10, 10), (20, 20, 20), (10, 30, 30)], columns=list('ABC'))
df.plot(kind="bar", stacked=True)
df.plot(subplots= [('A','B')],kind="bar", stacked=True)
plt.show()
print(df)
Issue Description
Using both the "stacked" and "subplots" option when drawing a bar graph changes how the bar graph is stacked.
Illustrated with image below where instead of numberically stacking the values for A and B it just physically overlays them. My guess is it doesn't properly use the "bottom" attribute when drawing B.
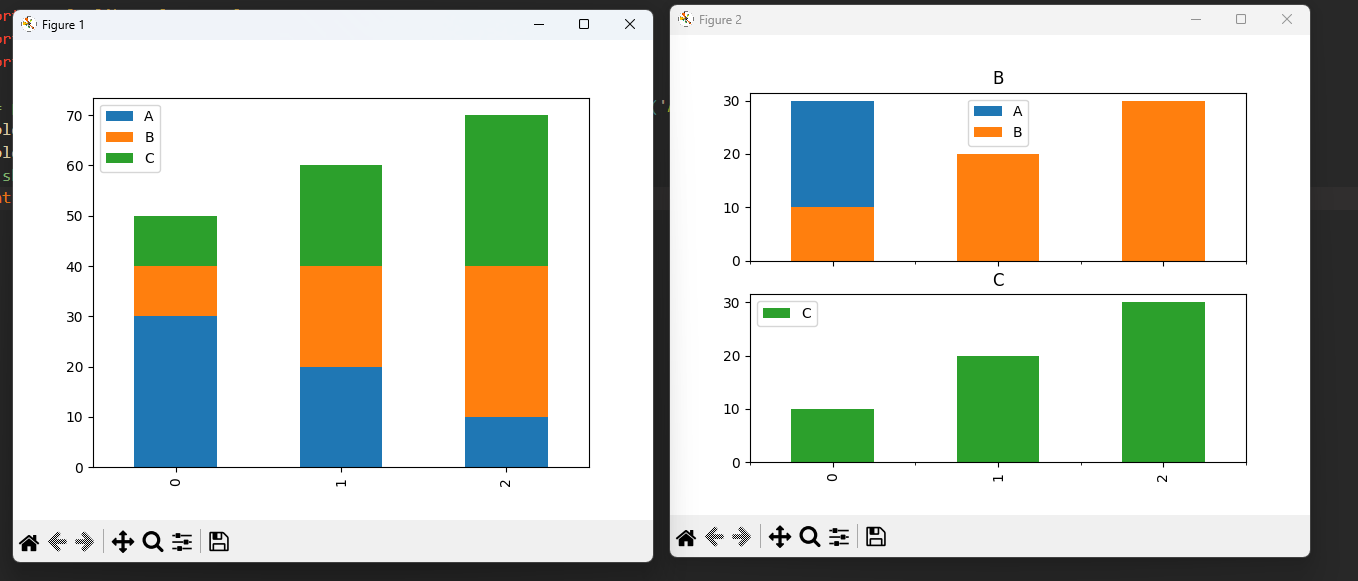
Expected Behavior
The behavior of the subplot version should be inline with when the option is not used. So the total of the values should equal to A+B for each element
Installed Versions
Comment From: eicchen02
I can take this and #61019 if other people can confirm the issue
Comment From: eicchen02
take