We are seeing this at the median and p99 across multiple services
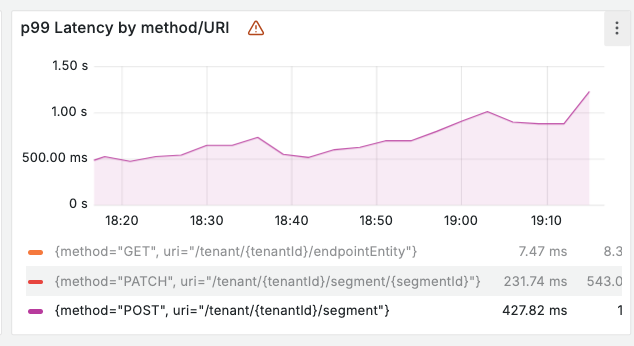
API Service 1
Before
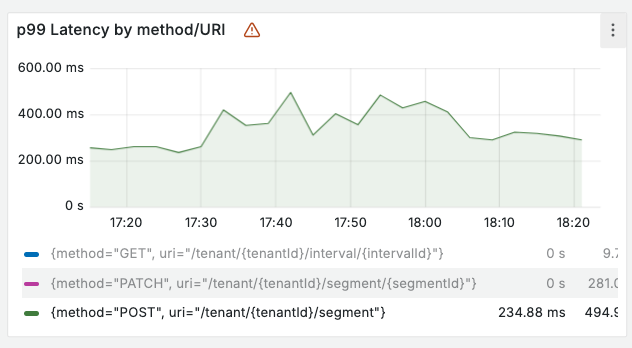
After (this reaches less than half the load of the "before" test case)
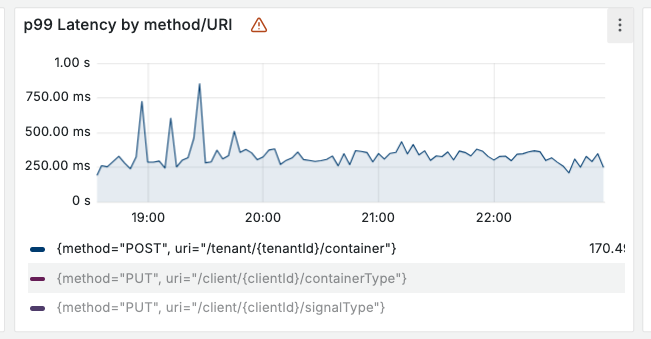
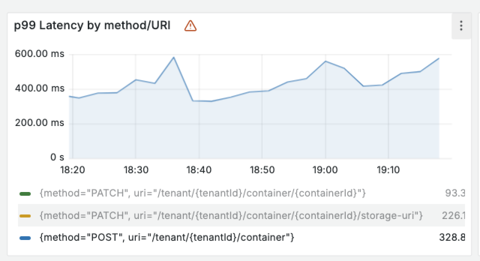
API for Service 2
Before
After (this also reaches less than half the load of the "before" test case)
The only thing we see so far that might explain is that the Hikari Connection Pool (for our Postgres DB) seems higher in both cases suggesting either Postgres Driver / Hibernate / JPA may be involved potentially.
Comment From: wilkinsona
Thanks for the report. Unfortunately, it isn’t actionable in its current form as it provides only minimal information about the affected services and how they’re implemented.
You’ve mentioned Postgres. Best guess at the moment is that this is similar to the performance problems mentioned in the comments on https://github.com/spring-projects/spring-boot/issues/44214.
Comment From: frankjkelly
@wilkinsona Thanks yeah I figured it wasn't enough but just in case other someone else pieces it all together before we do hopefully they might drop an idea here.
Thanks for the Postgres idea sadly it doesn't match our case (however it is good to know of those issues in 42.7.5 for sure)

Comment From: LeoTheDarvin
Hello, @frankjkelly . Is the issue relevant for you still?
Comment From: spring-projects-issues
If you would like us to look at this issue, please provide the requested information. If the information is not provided within the next 7 days this issue will be closed.
Comment From: frankjkelly
Hello, @frankjkelly . Is the issue relevant for you still?
No I don't believe so - I think the issue is due to another component as the issue goes away when we autoscale pods so it's some resource contention in our service
Comment From: wilkinsona
Thanks for the update. Closing.