Fixes gh-26729
@wilkinsona I picked your draft changes up and added the Actuator side of things.
TODO - [ ] Add docs
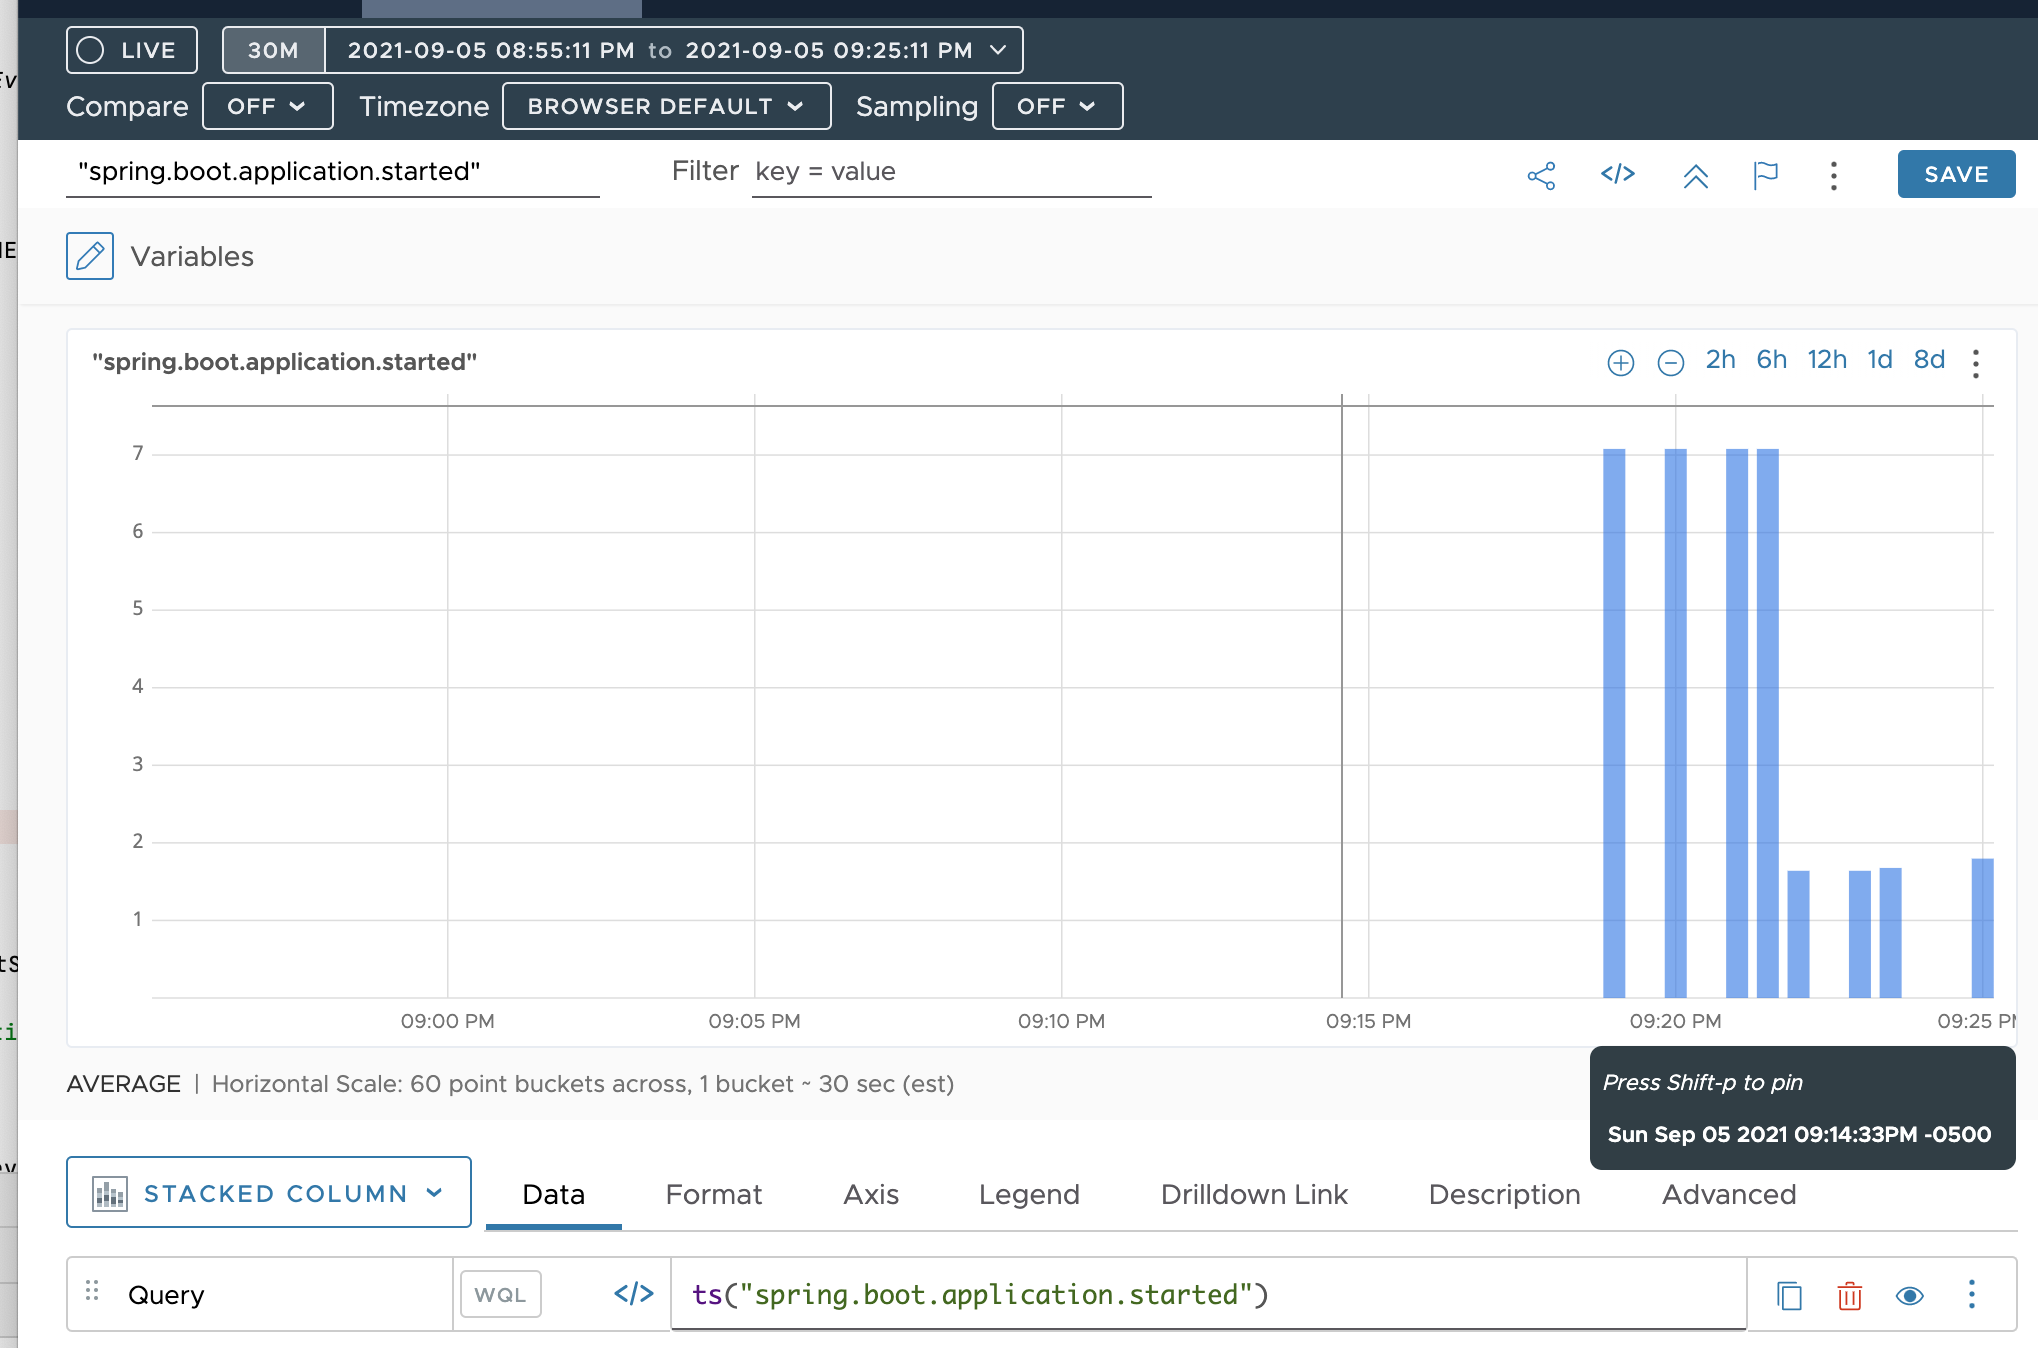
Here is what the metric looks like in Wavefront.
Comment From: onobc
I added the startup time to the ApplicationReadyEvent as well. You can tell by the graph below which portion of the startup time is due to the runners (I think its helpful). I am waiting to push that 2nd commit though until I get a nod on adding the metric.

Comment From: onobc
I went ahead and pushes the subsequent commits that add the times for application.running and the jvm uptime as the point that the application is in ready state.
Looks like this in WF...
Comment From: philwebb
Thanks very much for the PR @bono007.
We discussed some aspects of this today on our call and we think that the timer names should be changed from:
spring.boot.application.started
spring.boot.application.running
to:
application.started.time
application.ready.time
We're also wondering if there should be configuration options to change them.
Do you have any time to update the PR in that direction? If not, we can handle it when we merge.
Comment From: onobc
Thanks very much for the PR @bono007.
My pleasure @philwebb
We discussed some aspects of this today on our call and we think that the timer names should be changed from:
spring.boot.application.started
spring.boot.application.running
to:
application.started.time
application.ready.time
I ❤️ these new names - they were too verbose and in lockstep w/ the application event names. I went back and forth and just submitted these in hopes that I would get some feedback from team (I meant to call this out in comment). Ugghh naming... :)
One follow up question though, spring.boot.application.running.jvm change to default name of jvm.read.time or application.ready.jvm.time, or something else?
We're also wondering if there should be configuration options to change them.
I have went back/forth on the ability to change metric names (in general, not just here) and one hand its great because it allows consumers to name the metrics what they want for their custom requirements. On the other hand, it allows consumers to name the metrics what they want. This can lead to a somewhat standard metric name such as "mongodb.driver.commands" now being called "acme.company.mongodb.driver.or.whatever". I know the instrumentation in Micrometer tends to stay on the hardcoded side. I notice that SpringBoot has started to allow customization of most of the meters. I am ok w/ either approach but just wanted to bring this up.
Do you have any time to update the PR in that direction? If not, we can handle it when we merge.
Absolutely. On it now.
Comment From: wilkinsona
One follow up question though, spring.boot.application.running.jvm change to default name of jvm.read.time or application.ready.jvm.time, or something else?
Ah, that reminds me of the other thing we discussed. We don't think this should be part of Spring Boot. Instead, it feels like a general JVM metric that could be provided my Micrometer.
Comment From: onobc
One follow up question though, spring.boot.application.running.jvm change to default name of jvm.read.time or application.ready.jvm.time, or something else?
Ah, that reminds me of the other thing we discussed. We don't think this should be part of Spring Boot. Instead, it feels like a general JVM metric that could be provided my Micrometer.
Yep, I agree w/ that. It was really added here as a convenience to see how much of the Spring Boot startup attributed to the overall JVM uptime (or vice-versa). The thing that Micrometer will not have is knowing that the application is ready (aka Spring event listener).
There is already the UptimeMetrics which gives the JVM start time and uptime so that may be able to be used and correlated w/ these metrics. Or consumers could easily add a custom metric that listens for the app ready (like the JVM metric in this proposal).
Either way, I will push another commit that removes the JVM metric.
Comment From: snicoll
Thanks again, Chris.