I'm using Spring Boot (2.5.x) with Java 17 (Liberica JDK alpine-musl) and Shenandoan GC.
For a bunch of latest Spring Boot versions some GC's metrics are sometimes going to zero: - jvm_gc_live_data_size_bytes - jvm_gc_max_data_size_bytes
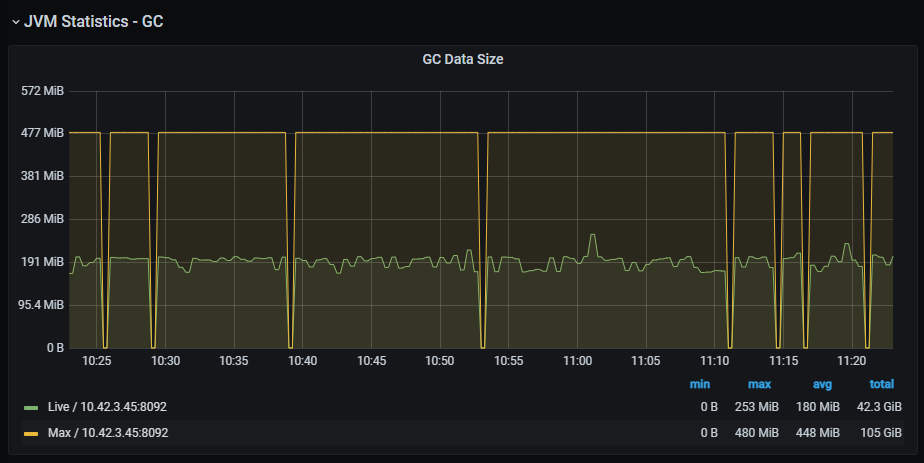
Previously (I don't remember exactly, but possibly on 2.4.x branch) — this graph was continuous.
It is looking weird now so I believe there is a bug somewhere.
Thanks.
Comment From: wilkinsona
Thanks for the report. Spring Boot itself isn't really involved with the capture and reporting of the GC metrics. That's done via Micrometer's JvmGcMetrics that Spring Boot auto-configures. Spring Boot 2.4.x uses Micrometer 1.6.x and Spring Boot 2.5.x uses Micrometer 1.7.x. There have been some changes to GC metrics in Micrometer 1.7.x such as https://github.com/micrometer-metrics/micrometer/pull/2560. I think the Micrometer team are best-placed to investigate this, at least in the first instance. To allow them to do so, please open a Micrometer issue, ideally with a minimal example that reproduces the behaviour that you have described.