🐞 Hot thread(reactor-http-epoll) appears when WebClient requests back-end services
- Problem Description
I implemented an application using WebFlux. This application provides REST service, and then calls (WebClient) backend service to get the result, and return the result.
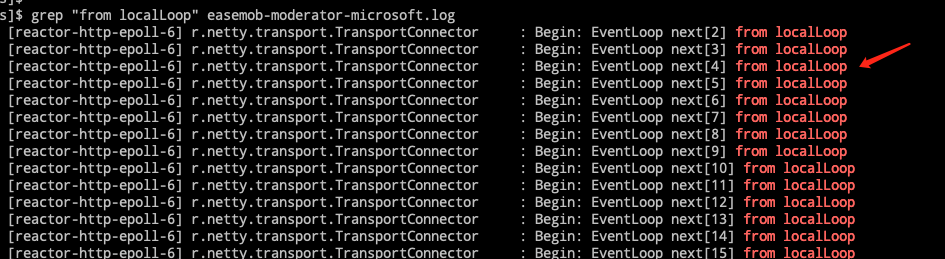
But, when I stress test, I found a hot thread appeared. Its name is similar to reactor-http-epoll.
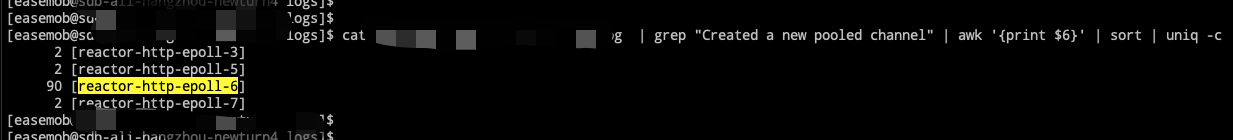
Through log analysis, I came to the conclusion that almost all Http connections are created by this hot thread, As shown
-
Spring version spring-boot-starter-parent 2.5.6 spring-boot-starter-webflux 2.5.6 io.netty 4.1.69.FINAL io.projectreactor:reactor-core:3.4.10 reacotr-pool-0.2.6 reactor-netty:1.0.11
-
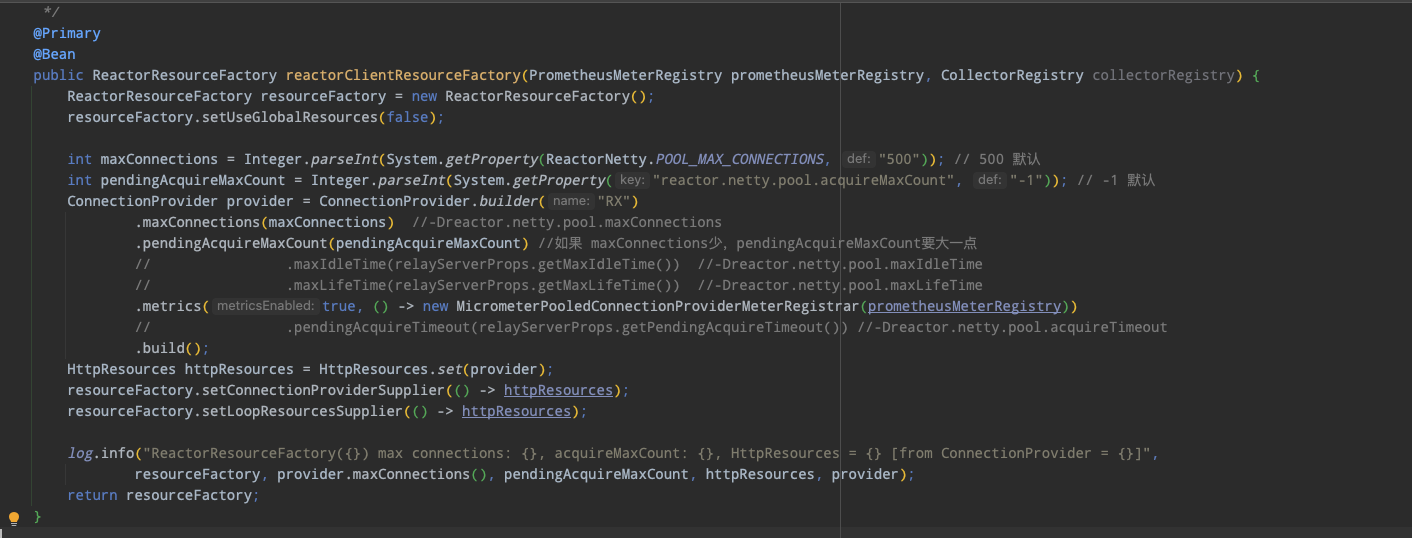
ReactorResourceFactory
@Primary @Bean public ReactorResourceFactory reactorClientResourceFactory(PrometheusMeterRegistry prometheusMeterRegistry, CollectorRegistry collectorRegistry) { ReactorResourceFactory resourceFactory = new ReactorResourceFactory(); resourceFactory.setUseGlobalResources(false);
int maxConnections = Integer.parseInt(System.getProperty(ReactorNetty.POOL_MAX_CONNECTIONS, "500")); // 500 默认
int pendingAcquireMaxCount = Integer.parseInt(System.getProperty("reactor.netty.pool.acquireMaxCount", "-1")); // -1 默认
ConnectionProvider provider = ConnectionProvider.builder("RX")
        .maxConnections(maxConnections)  //-Dreactor.netty.pool.maxConnections
        .pendingAcquireMaxCount(pendingAcquireMaxCount) //如果 maxConnections少,pendingAcquireMaxCount要大一点
        //                .maxIdleTime(relayServerProps.getMaxIdleTime())  //-Dreactor.netty.pool.maxIdleTime
        //                .maxLifeTime(relayServerProps.getMaxLifeTime())  //-Dreactor.netty.pool.maxLifeTime
        .metrics(true, () -> new MicrometerPooledConnectionProviderMeterRegistrar(prometheusMeterRegistry))
        //                .pendingAcquireTimeout(relayServerProps.getPendingAcquireTimeout()) //-Dreactor.netty.pool.acquireTimeout
        .build();
HttpResources httpResources = HttpResources.set(provider);
resourceFactory.setConnectionProviderSupplier(() -> httpResources);
resourceFactory.setLoopResourcesSupplier(() -> httpResources);

log.info("ReactorResourceFactory({}) max connections: {}, acquireMaxCount: {}, HttpResources = {} [from ConnectionProvider = {}]",
        resourceFactory, provider.maxConnections(), pendingAcquireMaxCount, httpResources, provider);
return resourceFactory;
}
🎁 Reasons for the emergence of hot threads, The hot thread of this stress test is reactor-http-epoll-6
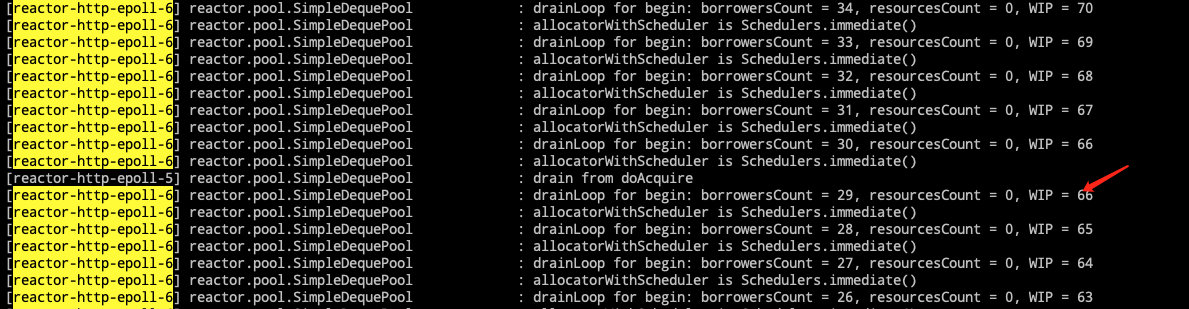
- The root cause of the problem lies in these two classes: reactor.pool.SimpleDequePool and reactor.netty.resources.ColocatedEventLoopGroup
- When reactor-http-epoll-6 runing drainLoop, other threads acquire PoolRef almost at the same time. Therefore, reactor-http-epoll-6 performs a large number of allocators, and allocatorWithScheduler is Schedulers.immediate(). And this allocator is PooledConnectionAllocator.connectChannel return value Publisher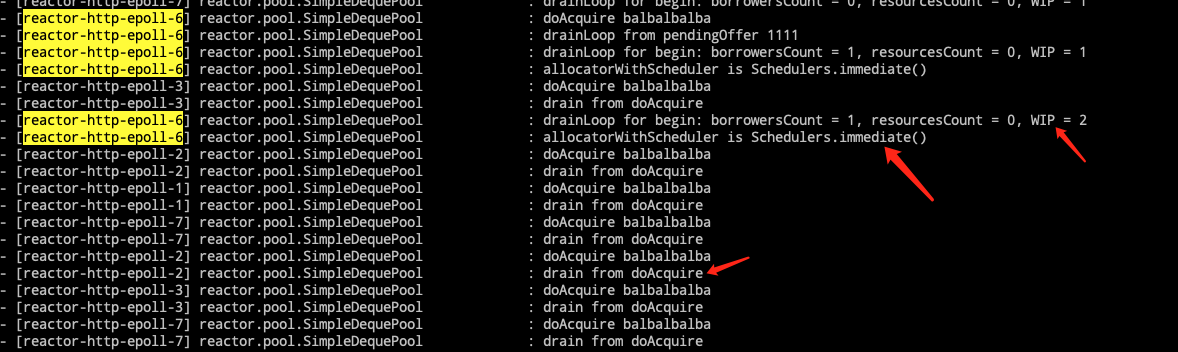
🎁 My advice - My solution is to no longer use ColocatedEventLoopGroup - Or, WebClient ExchangeFilterFunction subscribeOn other threads
🎁 The above is my analysis, it may be accurate, please correct me. thanks
Comment From: bclozel
Hello,
This doesn't look like a misconfiguration on the Spring Boot side, but rather a concern about the runtime behavior. It's not clear whether this load is can be considered as abnormal in a performance benchmark scenario. It's even less clear given we have no way to reproduce this or point to a particular aspect of the benchmark.
Unfortunately I can't move this issue to reactor Netty directly. Could you reopen it against that project? You should also provide more information about the benchmark, ideally a sample application that can help reproduce the behavior you're seeing.
Thanks!
Comment From: davidyangss
https://github.com/reactor/reactor-netty/issues/1954